

Graph of the Week
Graph of the Week
Representation of Female Participants in NIH-funded Research

Graph of the Week is an opportunity to share recently published data graphs of potential interest. Subscribers and followers are encouraged to discuss the graphs in the comments section.
This week’s graph illustrates the percentage of participants in research trials funded by the National Institutes of Health (NIH) in fiscal years 2021 and 2022 who were girls or women.
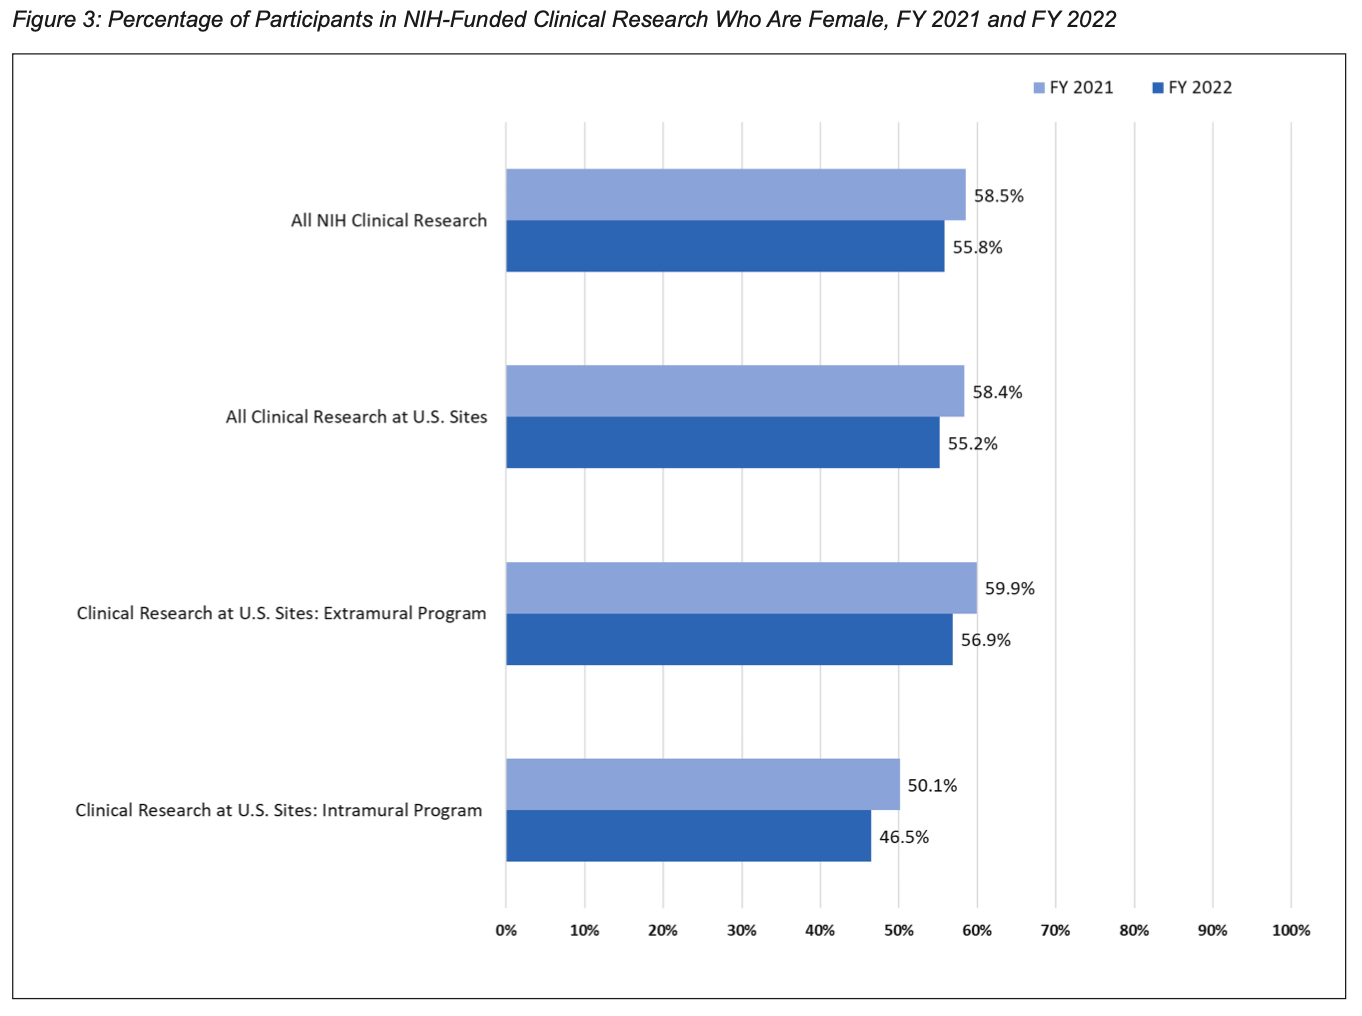
Source: Office of Research on Women’s Health (2023). Report of the Advisory Committee on Research on Women’s Health, Fiscal Years 2021–2022.
SUPPORT THE NUZZO LETTER
If you appreciated this content, please consider supporting The Nuzzo Letter with a one-time or recurring donation. Your support is greatly appreciated. It helps me to continue to work on independent research projects and fight for my evidence-based discourse. To donate, click the DonorBox logo. In two simple steps, you can donate using ApplePay, PayPal, or another service. Thank you.
