


International Students at Australian Universities
Graph of the Week

This week’s graphs, courtesy of a report by the Australian Department of Education, illustrate the numbers and proportions of international students enrolled at Australian universities from 2015 to 2024 (top 10 nationalities).
Key Points
Since 2015, numbers of international students enrolled at Australian universities have increased. However, during 2021 and 2022, international enrolments were significantly reduced due to the COVID-19 pandemic.
In 2024, there were 662,895 international students enrolled at Australian universities. This enrolment was approximately double the enrolment observed in 2015.
Each year, the greatest proportion of international students are from China (~30%) followed by India and Nepal.
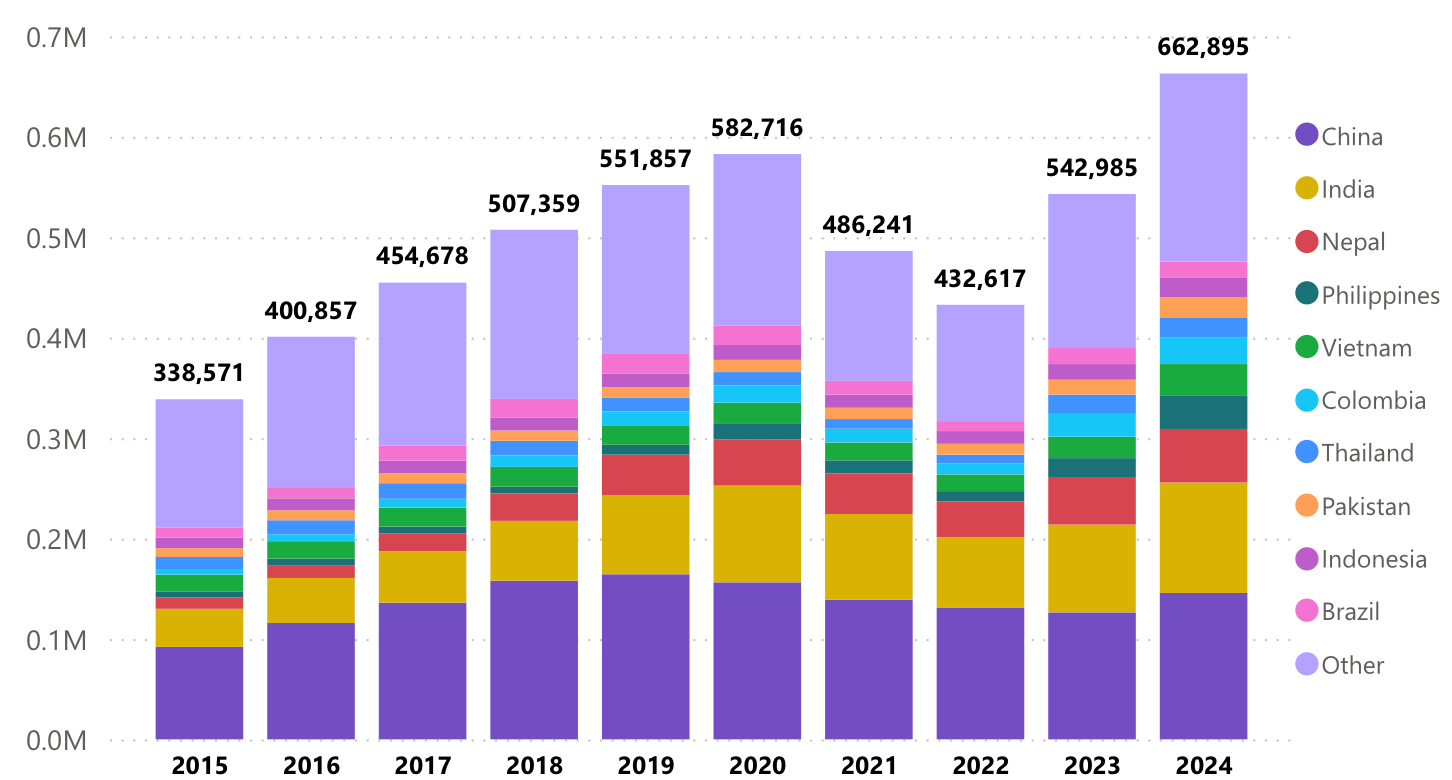

Source: Australian Department of Education.
Bonus Commentary
Australian universities depend highly on international students. Globally, among major countries, Australia ranks number one in terms of proportion of international students. In 2018, Australia had the third largest international student population in the world. Debate exists about whether Australian universities enrol too many international students. Discussion on this debate can be found in Salvatore Babones’ book, Australian Universities: Can They Reform?
More Information
Australia’s Universities: Can they Reform? Centre for Independent Studies, 2022.
Group of Eight universities warn they are reliant on international student fees as government looks to cap enrolments. ABC News, 2024.
Related Content at The Nuzzo Letter


SUPPORT THE NUZZO LETTER
If you appreciated this content, please consider supporting The Nuzzo Letter with a one-time or recurring donation. Your support is greatly appreciated. It helps me to continue to work on independent research projects and fight for my evidence-based discourse. To donate, click the DonorBox logo. In two simple steps, you can donate using ApplePay, PayPal, or another service. Thank you.
