


Sex of Health and Medical Degree Earners in the United States
Graph of the Week

This week’s graphs show the number of men and women in the United States (U.S.) who have earned university degrees in various health and medical fields. The data were acquired from annual spreadsheets published by the National Center for Education Statistics. For some academic fields, data were not available from the 1990s or part of the 2000s.
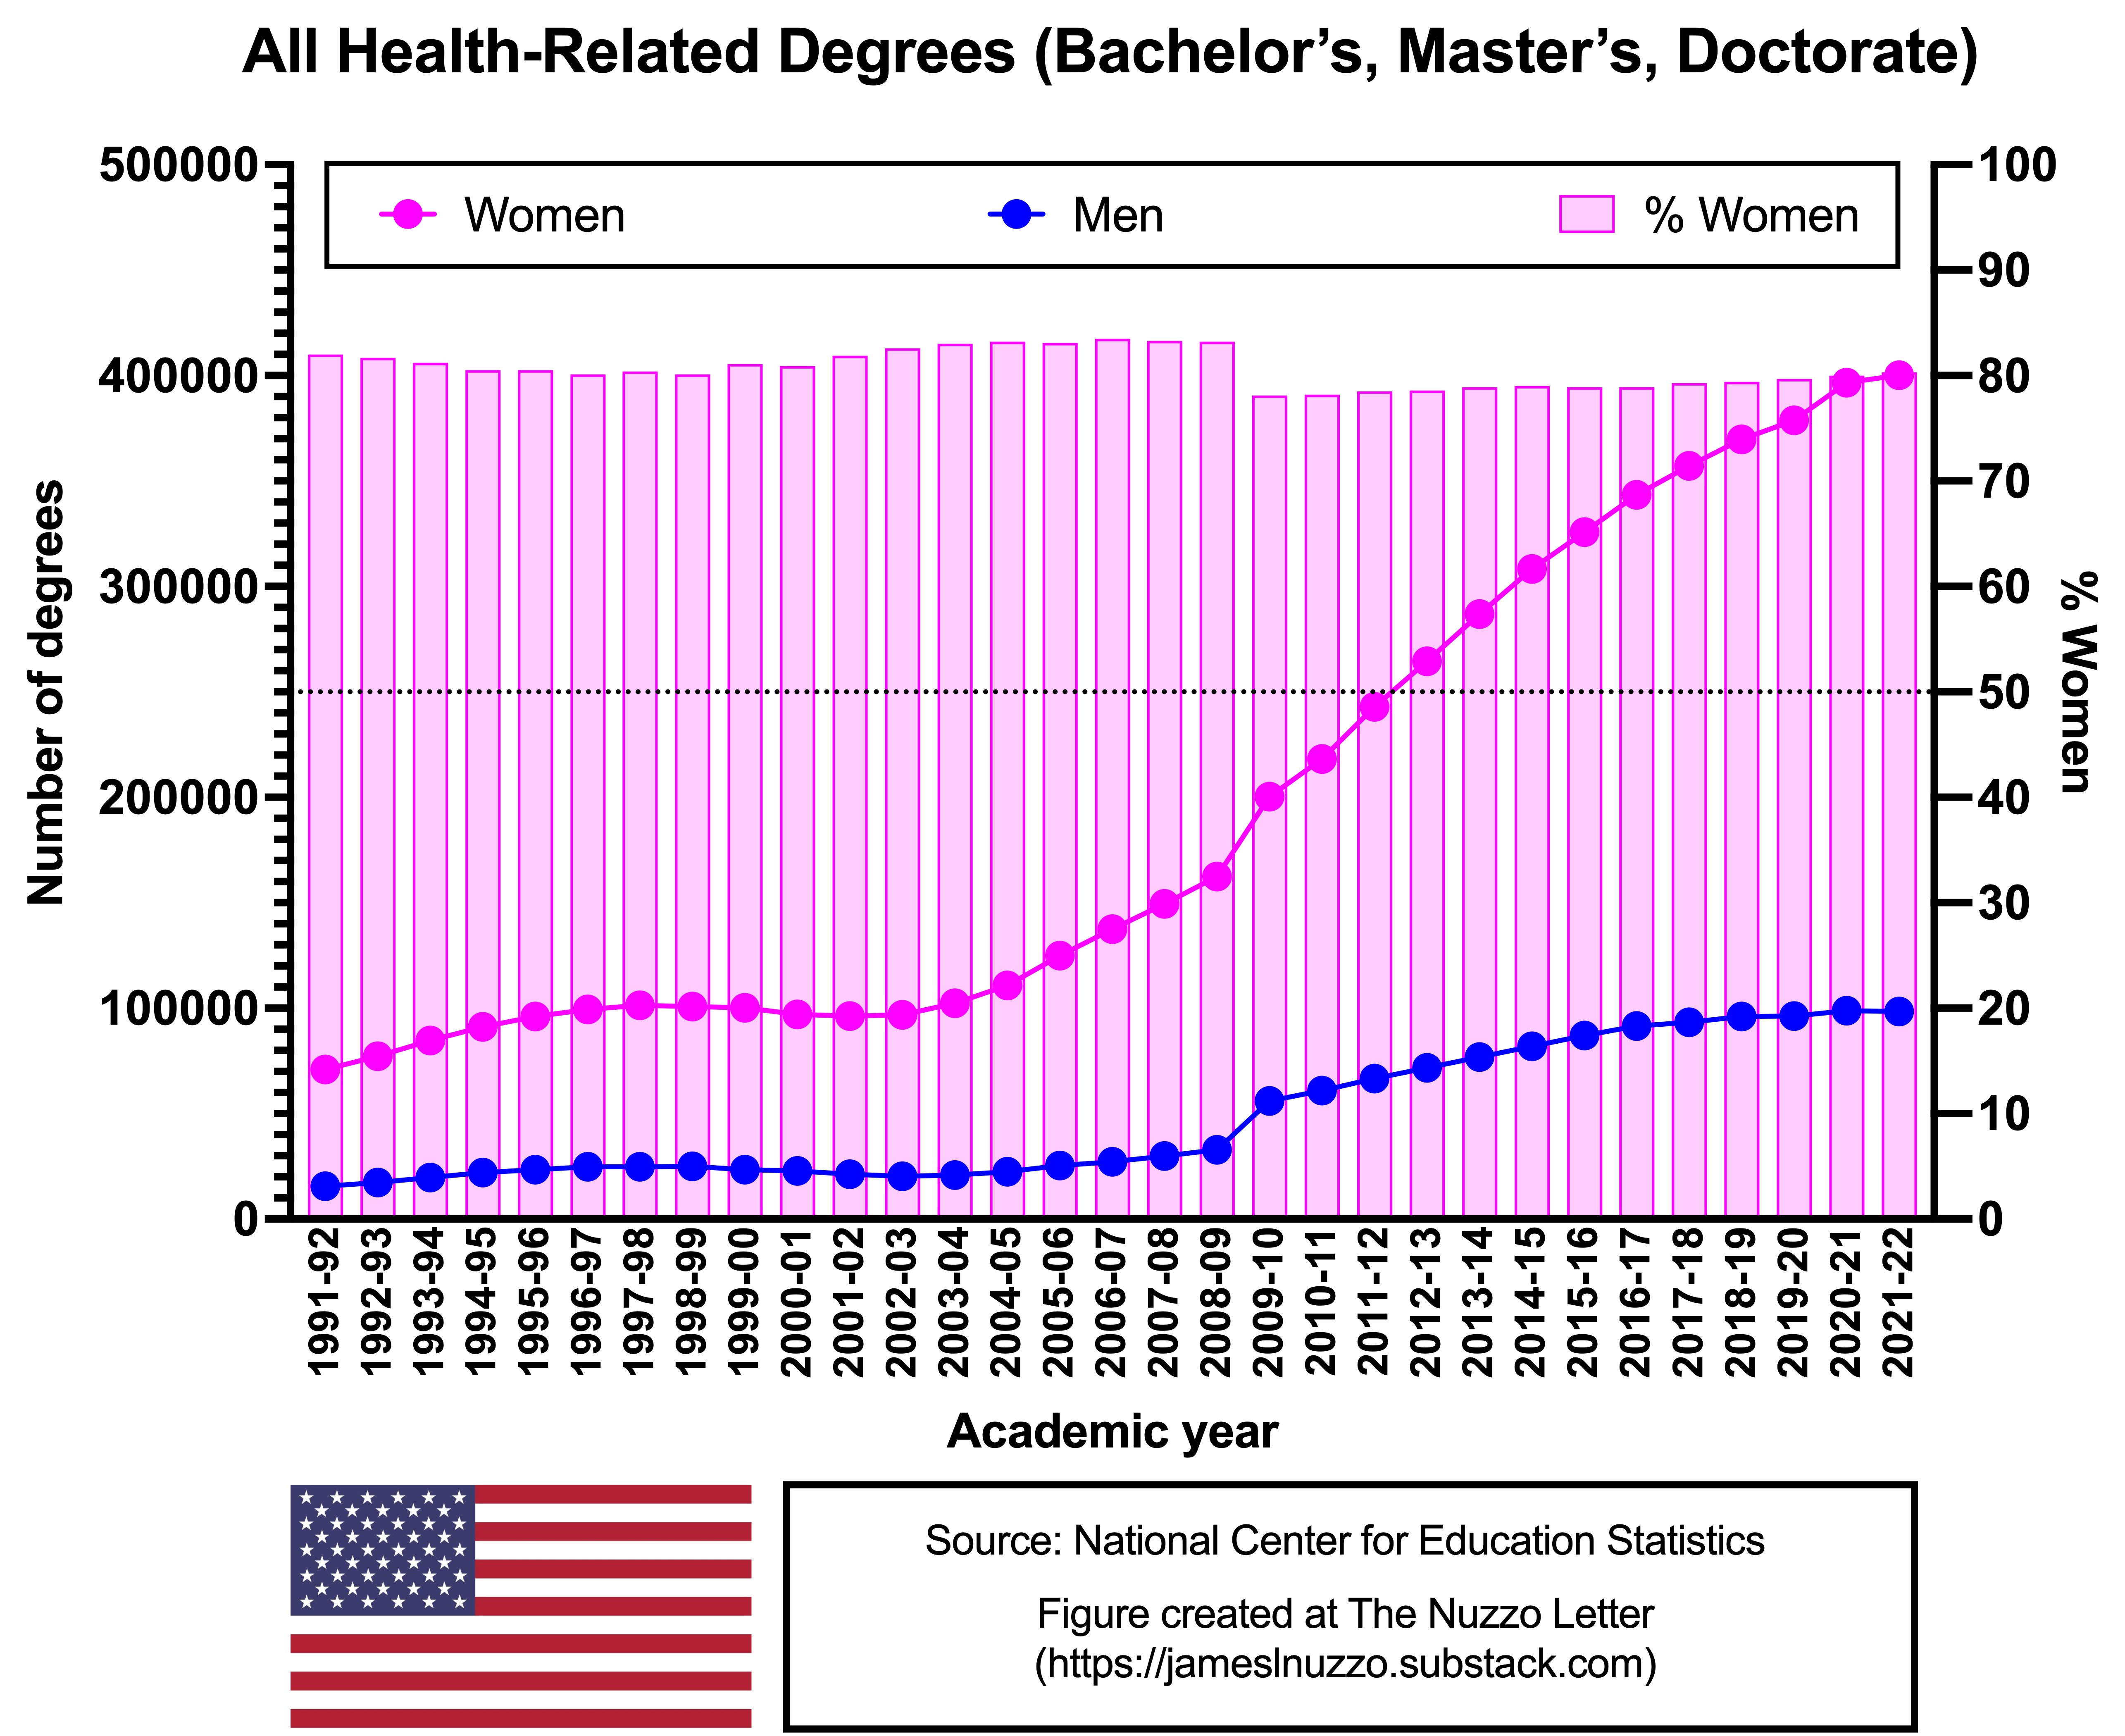
All Health-Related Degrees
Women are the majority of degree earners when all degree types are summed across all health and medical fields.
In 2021-22, women comprised 80% of all university degree earners in health-related fields in the U.S.
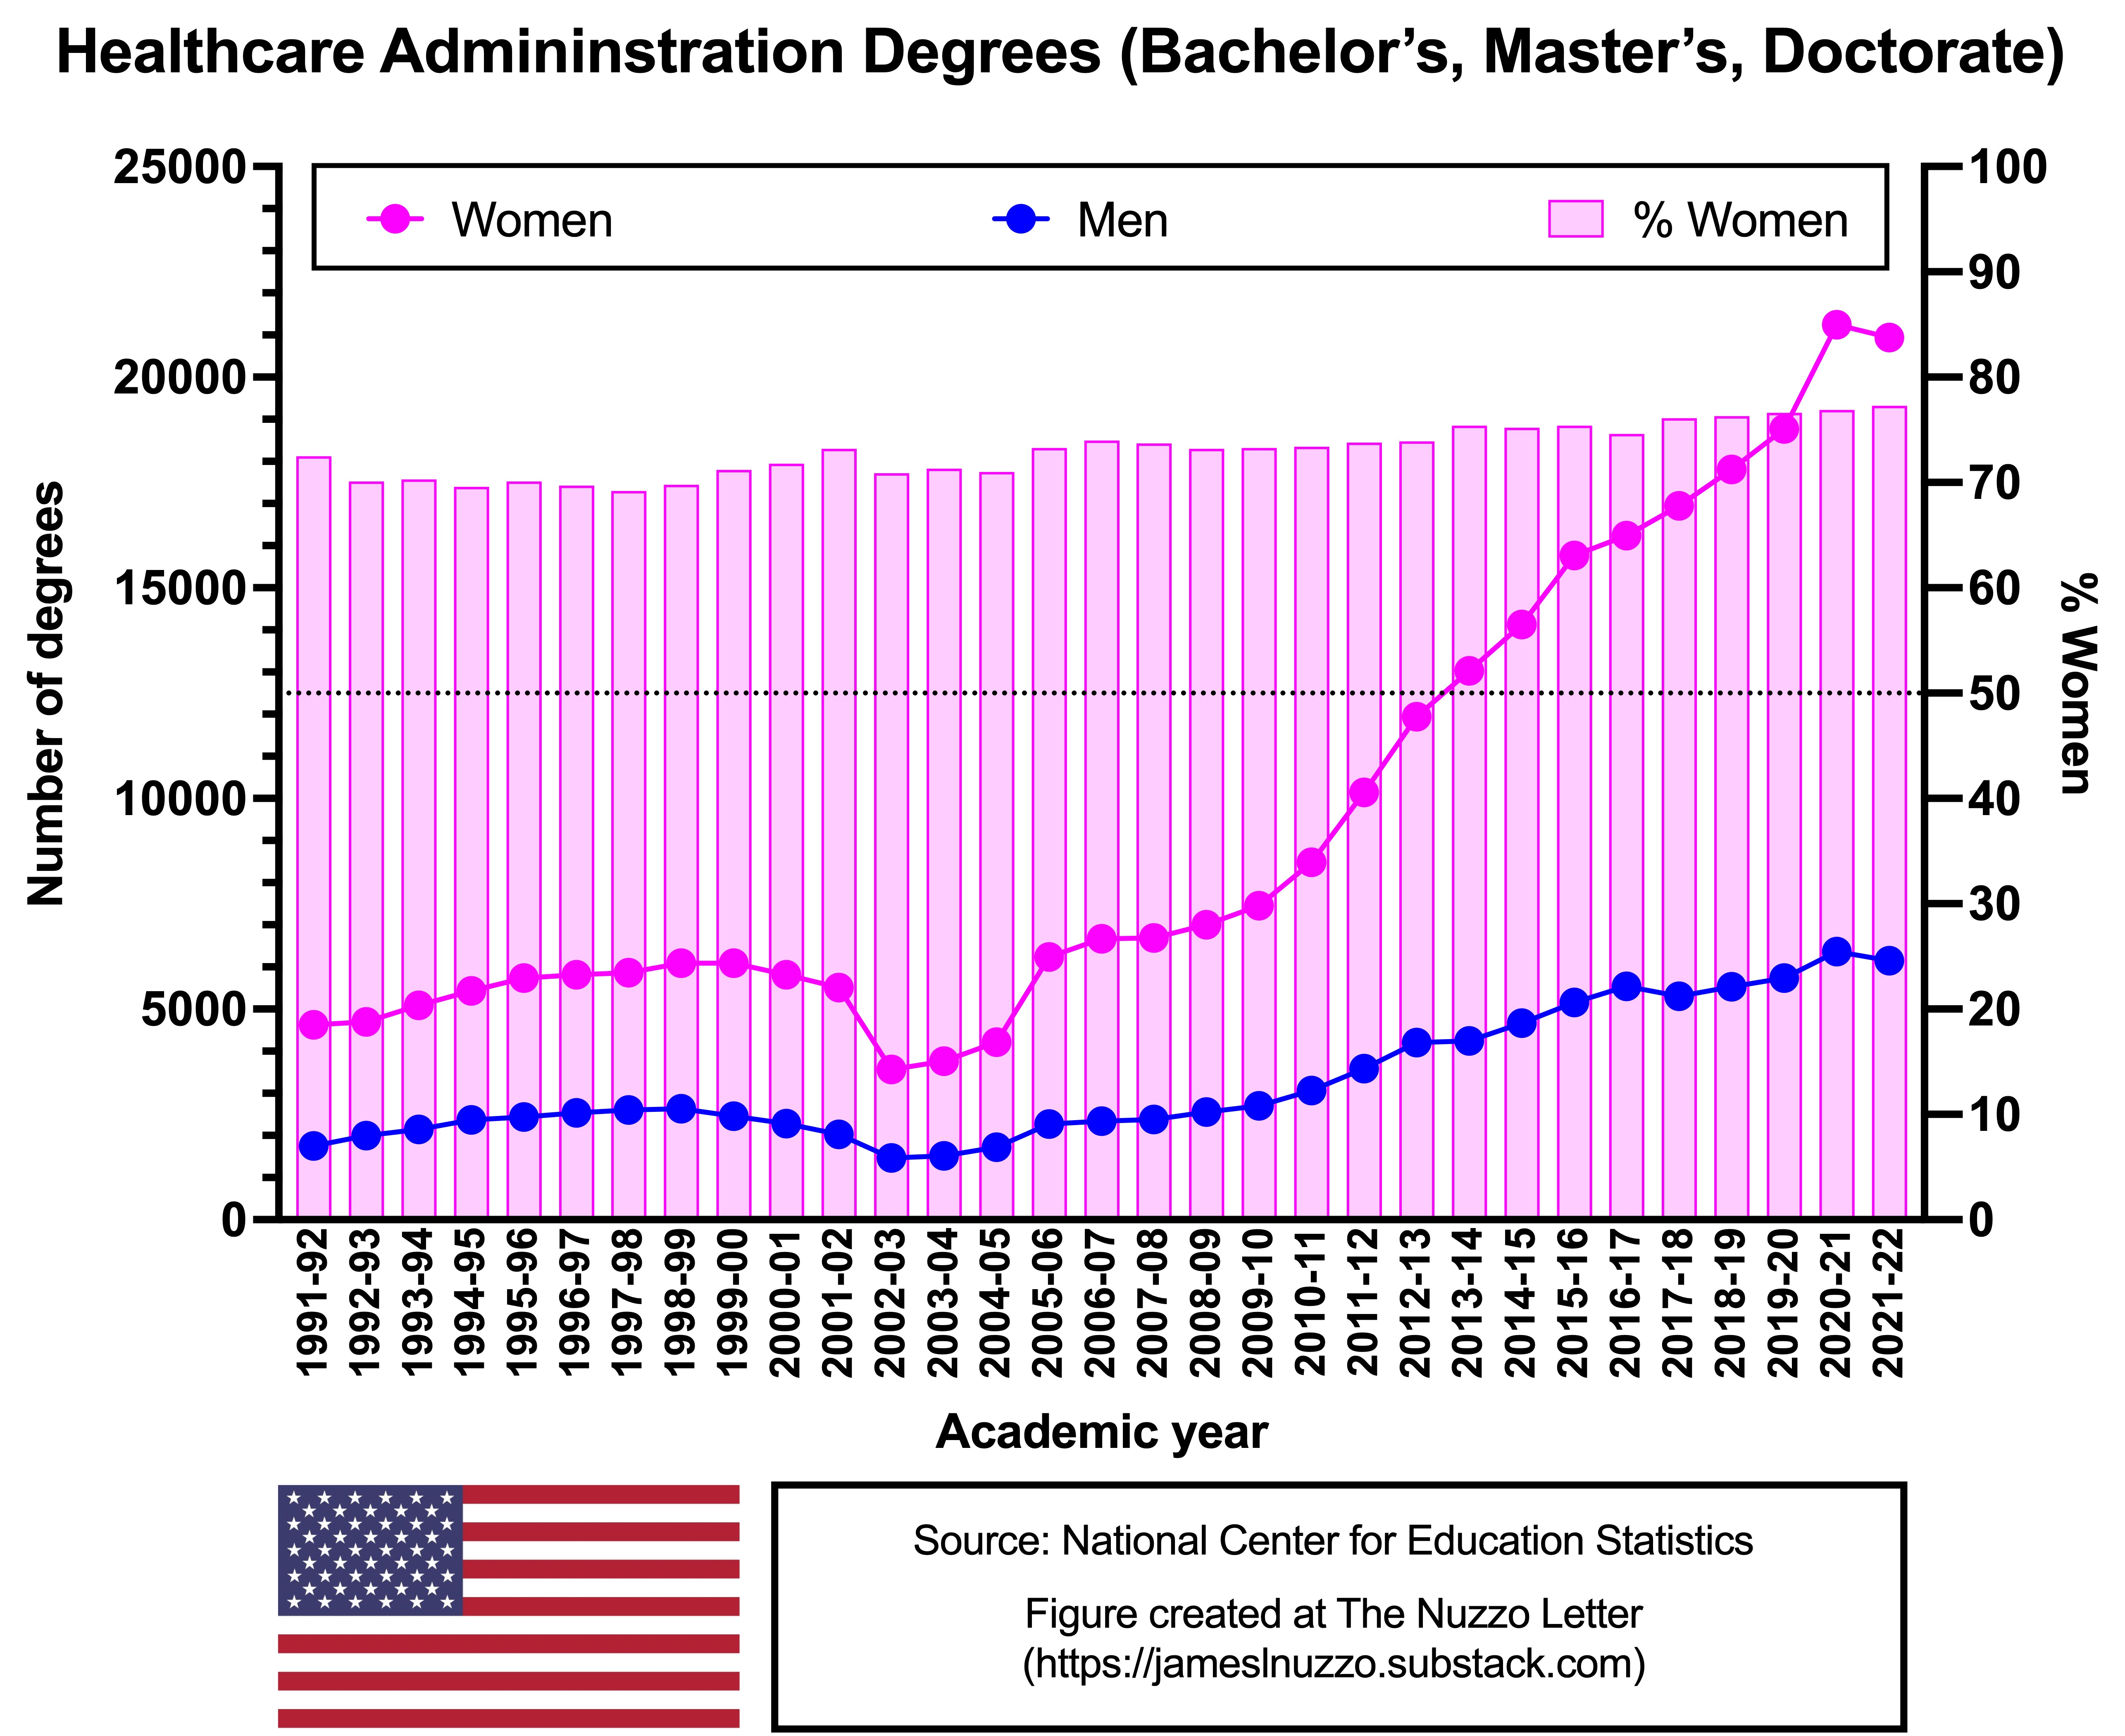
Healthcare Administration and Management
Women are the majority of degree earners in healthcare administration and management when all degree types are summed.
In 2021-22, women comprised 77% of all university degree earners in healthcare administration and management in the U.S.
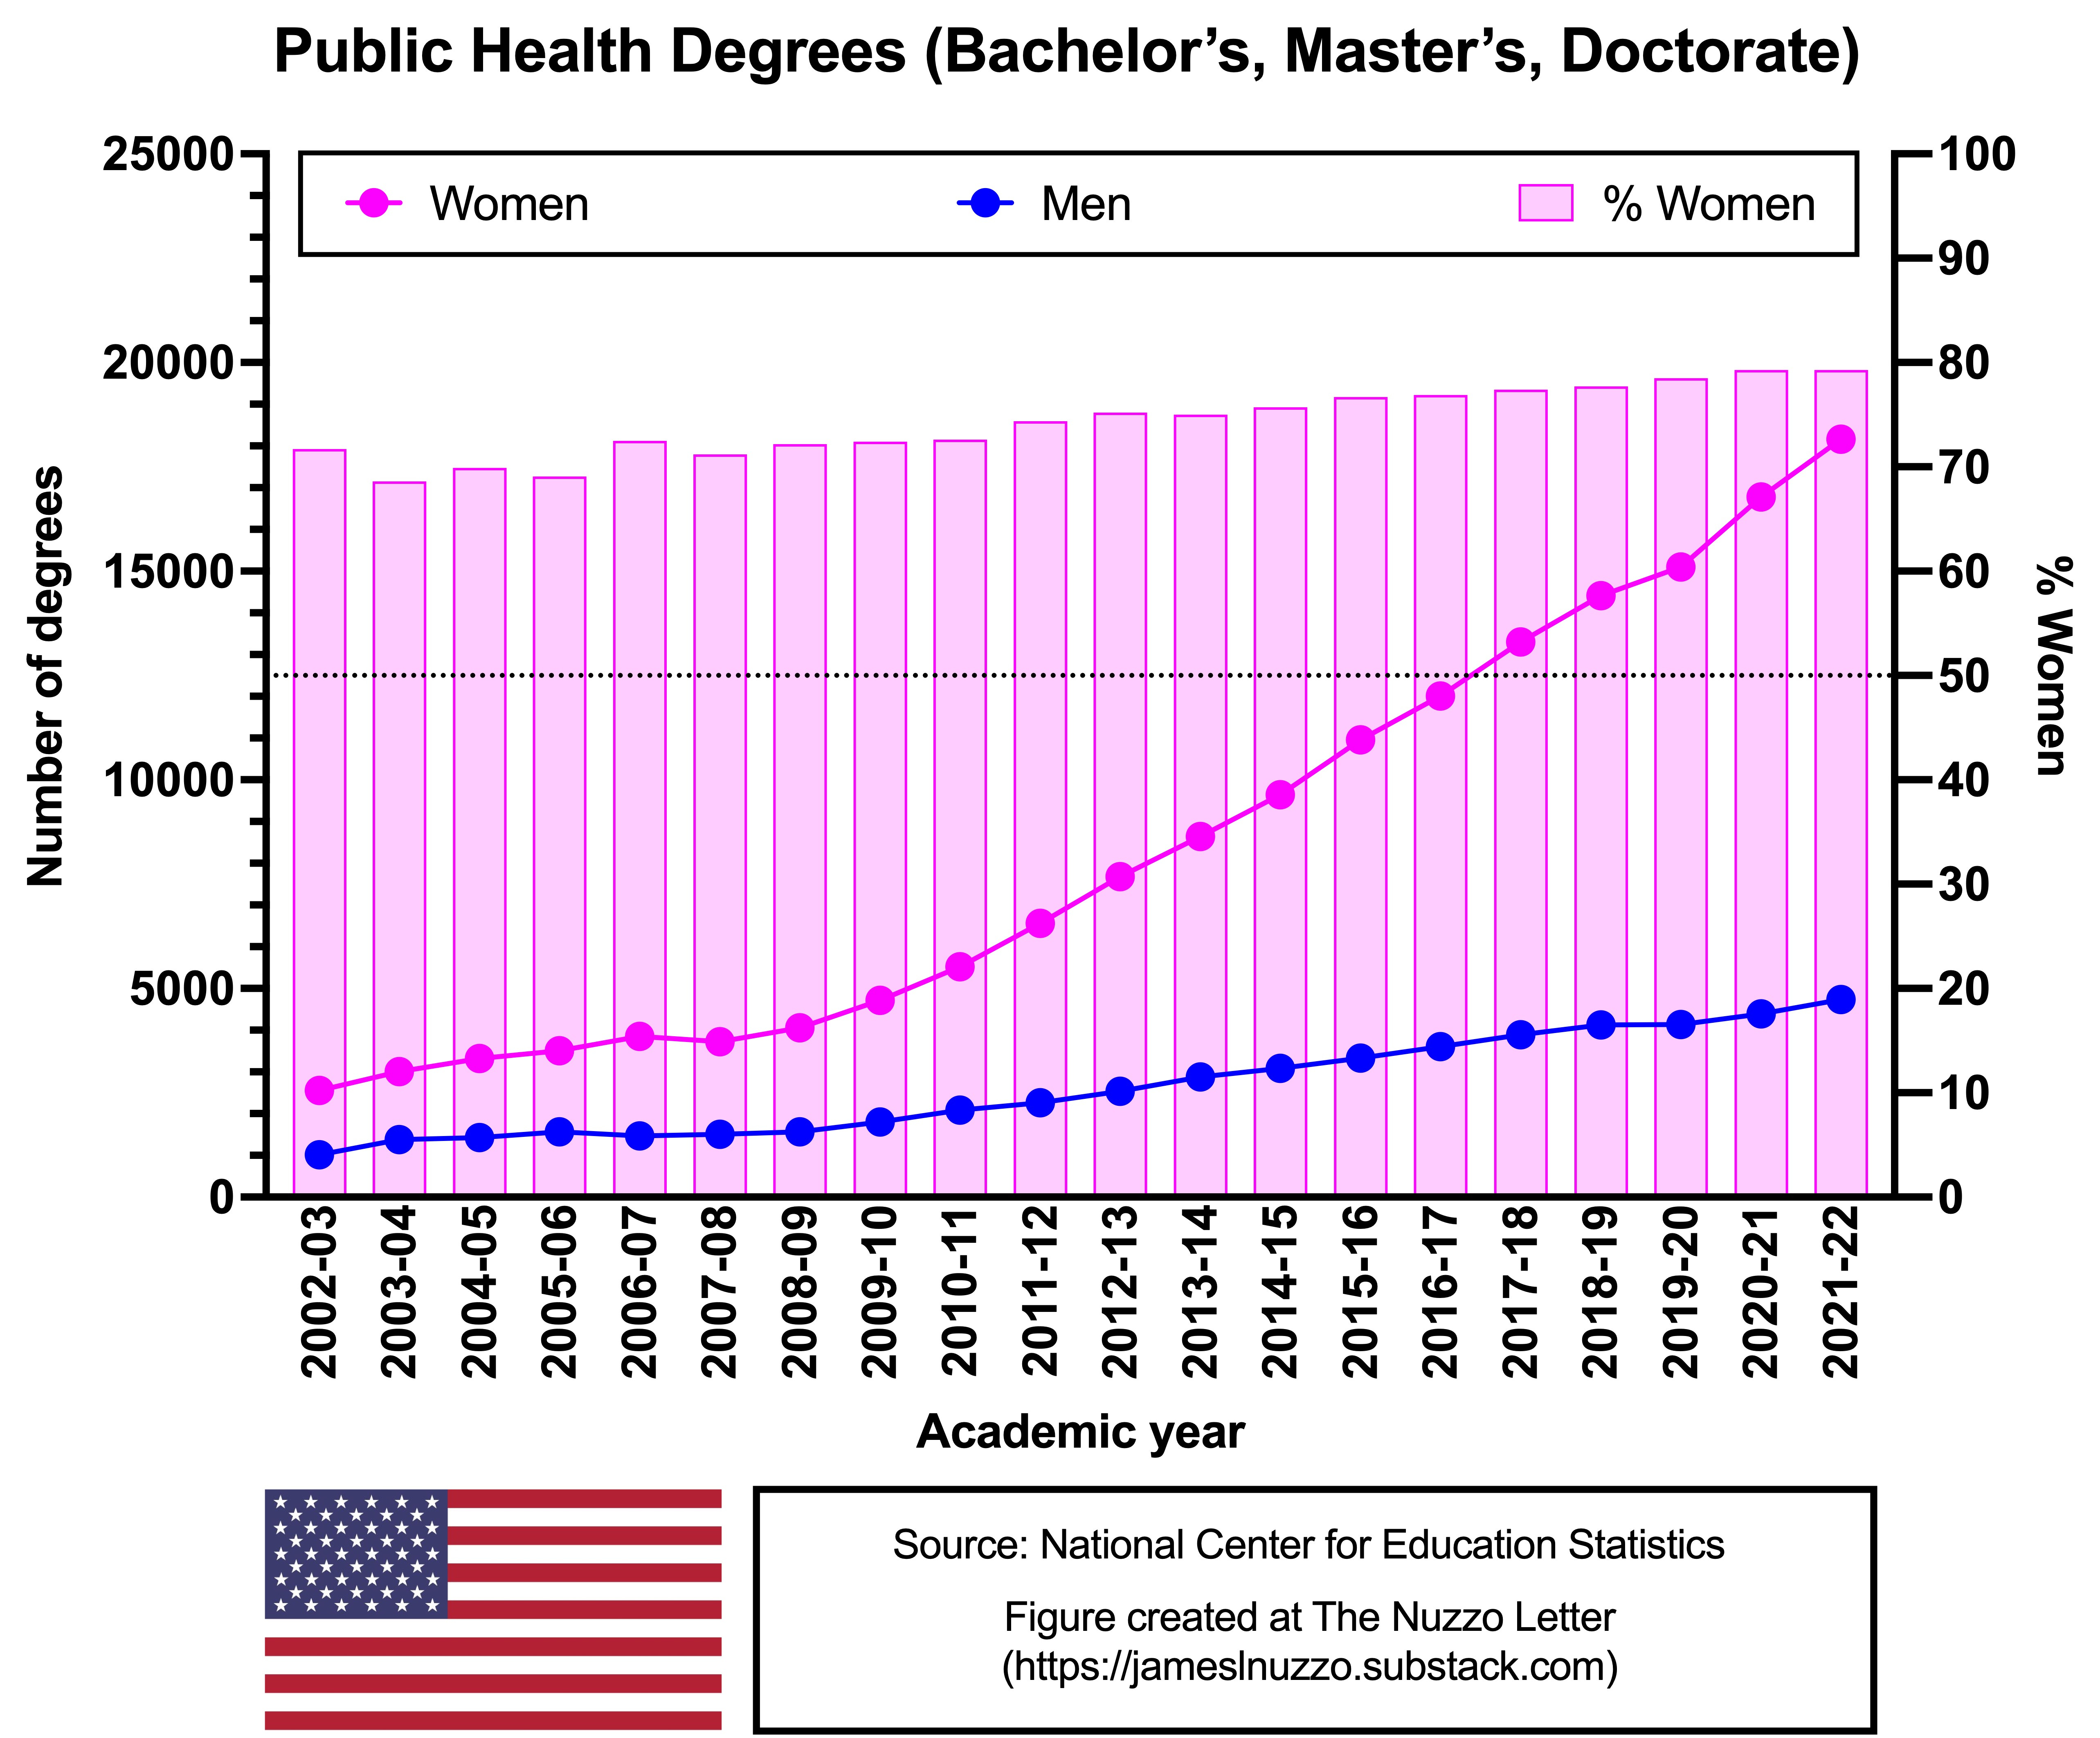
Public Health
Women are the majority of degree earners in public health when all degree types are summed.
In 2021-22, women comprised 79% of all university degree earners in public health in the U.S.
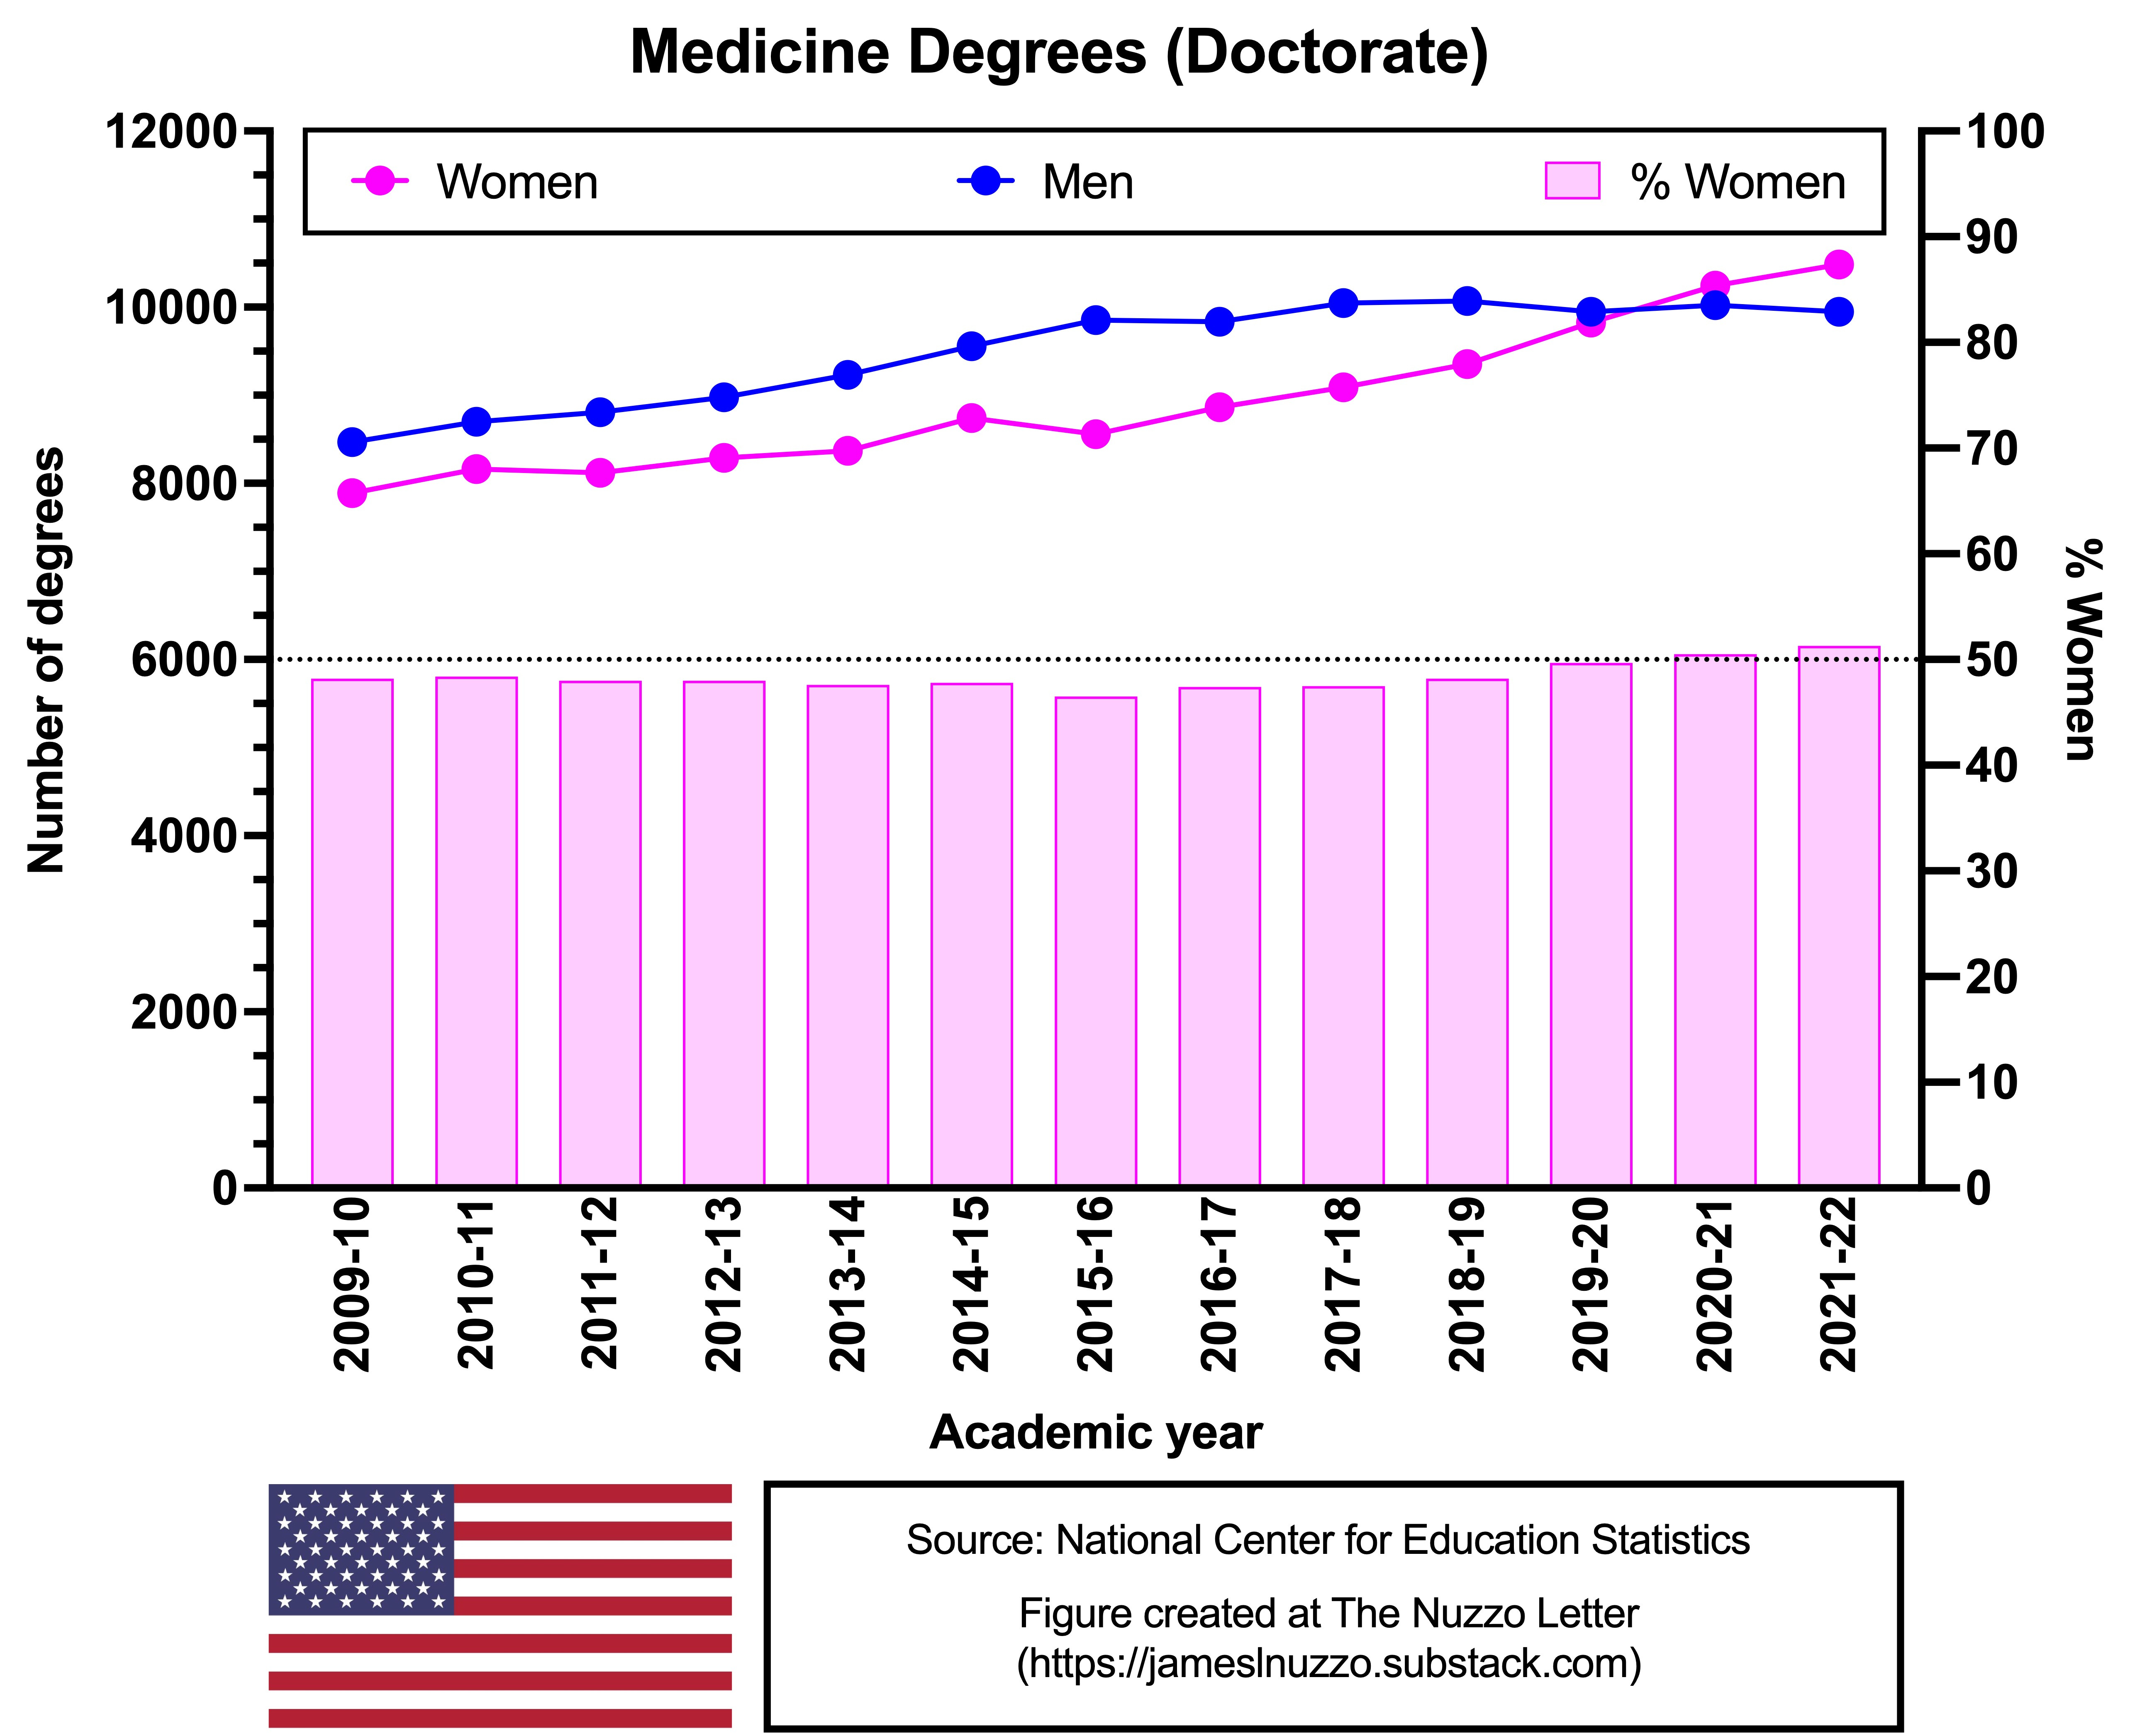
Medicine
Since 2009-10, men and women have comprised roughly equal proportions of doctorate degree earners in the field of medicine.
In 2020-21, for the first time, women surpassed men in doctorate degrees earned in medicine.
In 2021-22, women comprised 51% of all doctorate degree earners in medicine in the U.S.
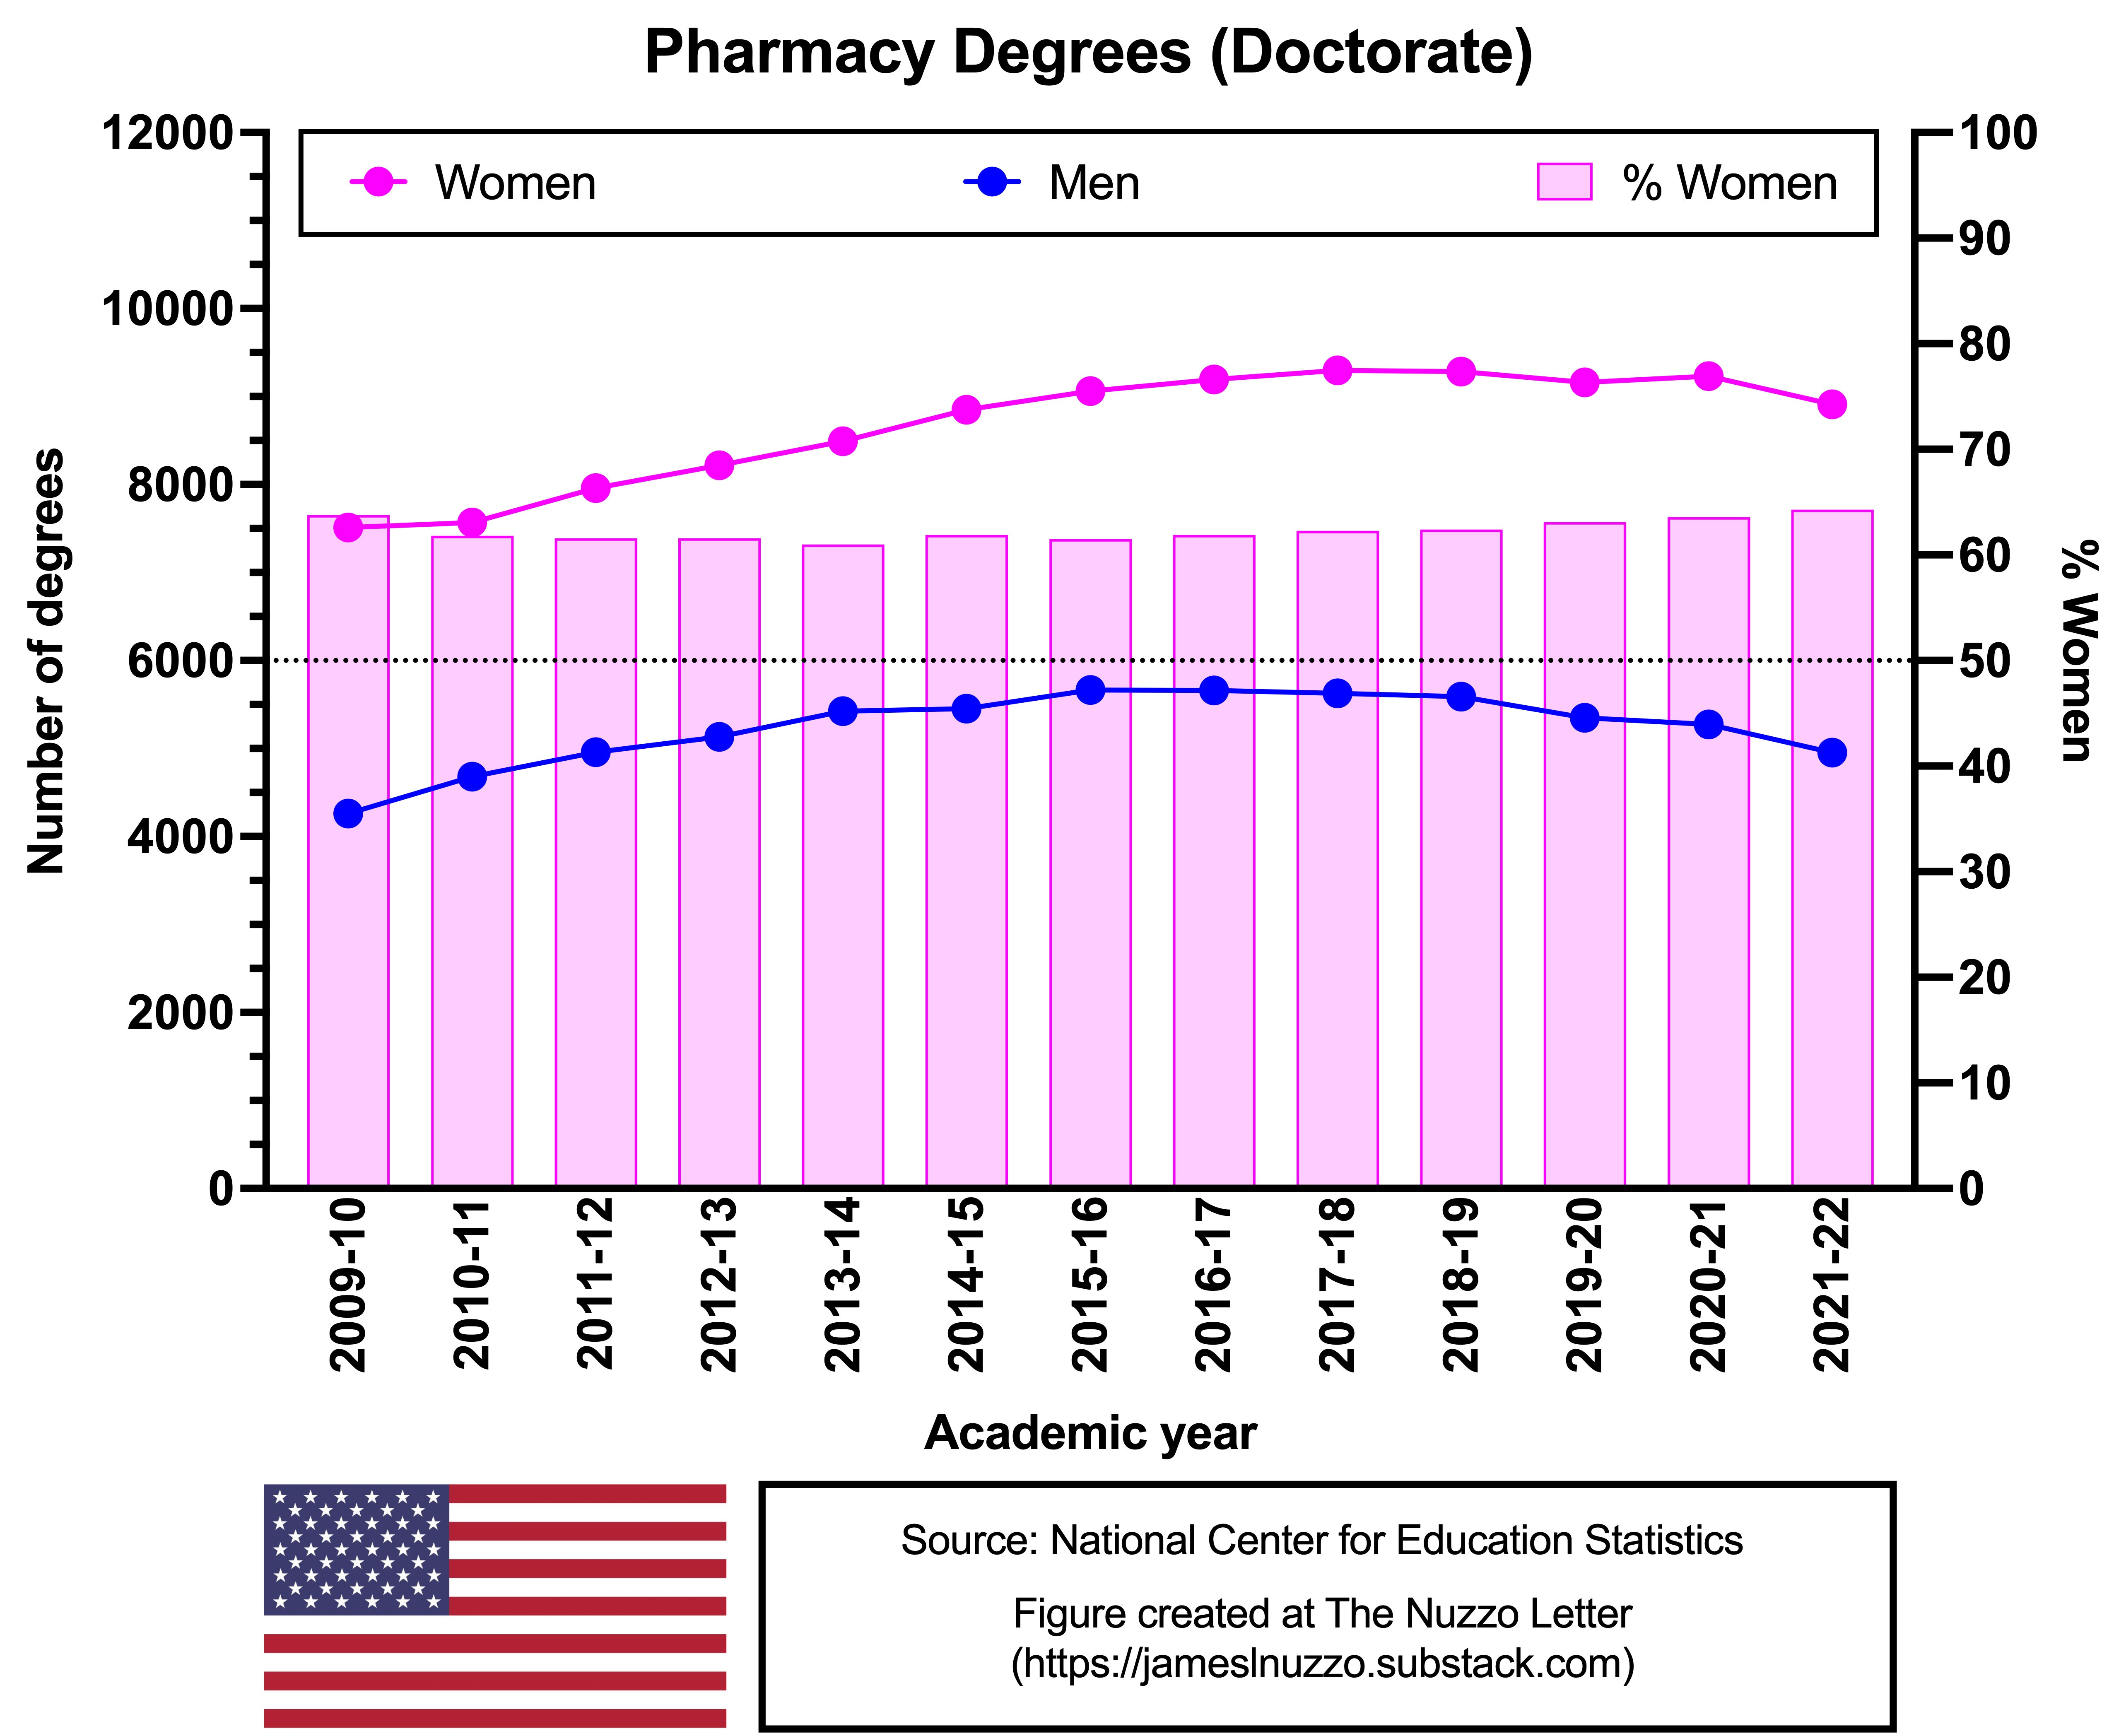
Pharmacy
Women are the majority of doctorate degree earners in pharmacy.
In 2021-22, women comprised 64% of all doctorate degree earners in pharmacy in the U.S.
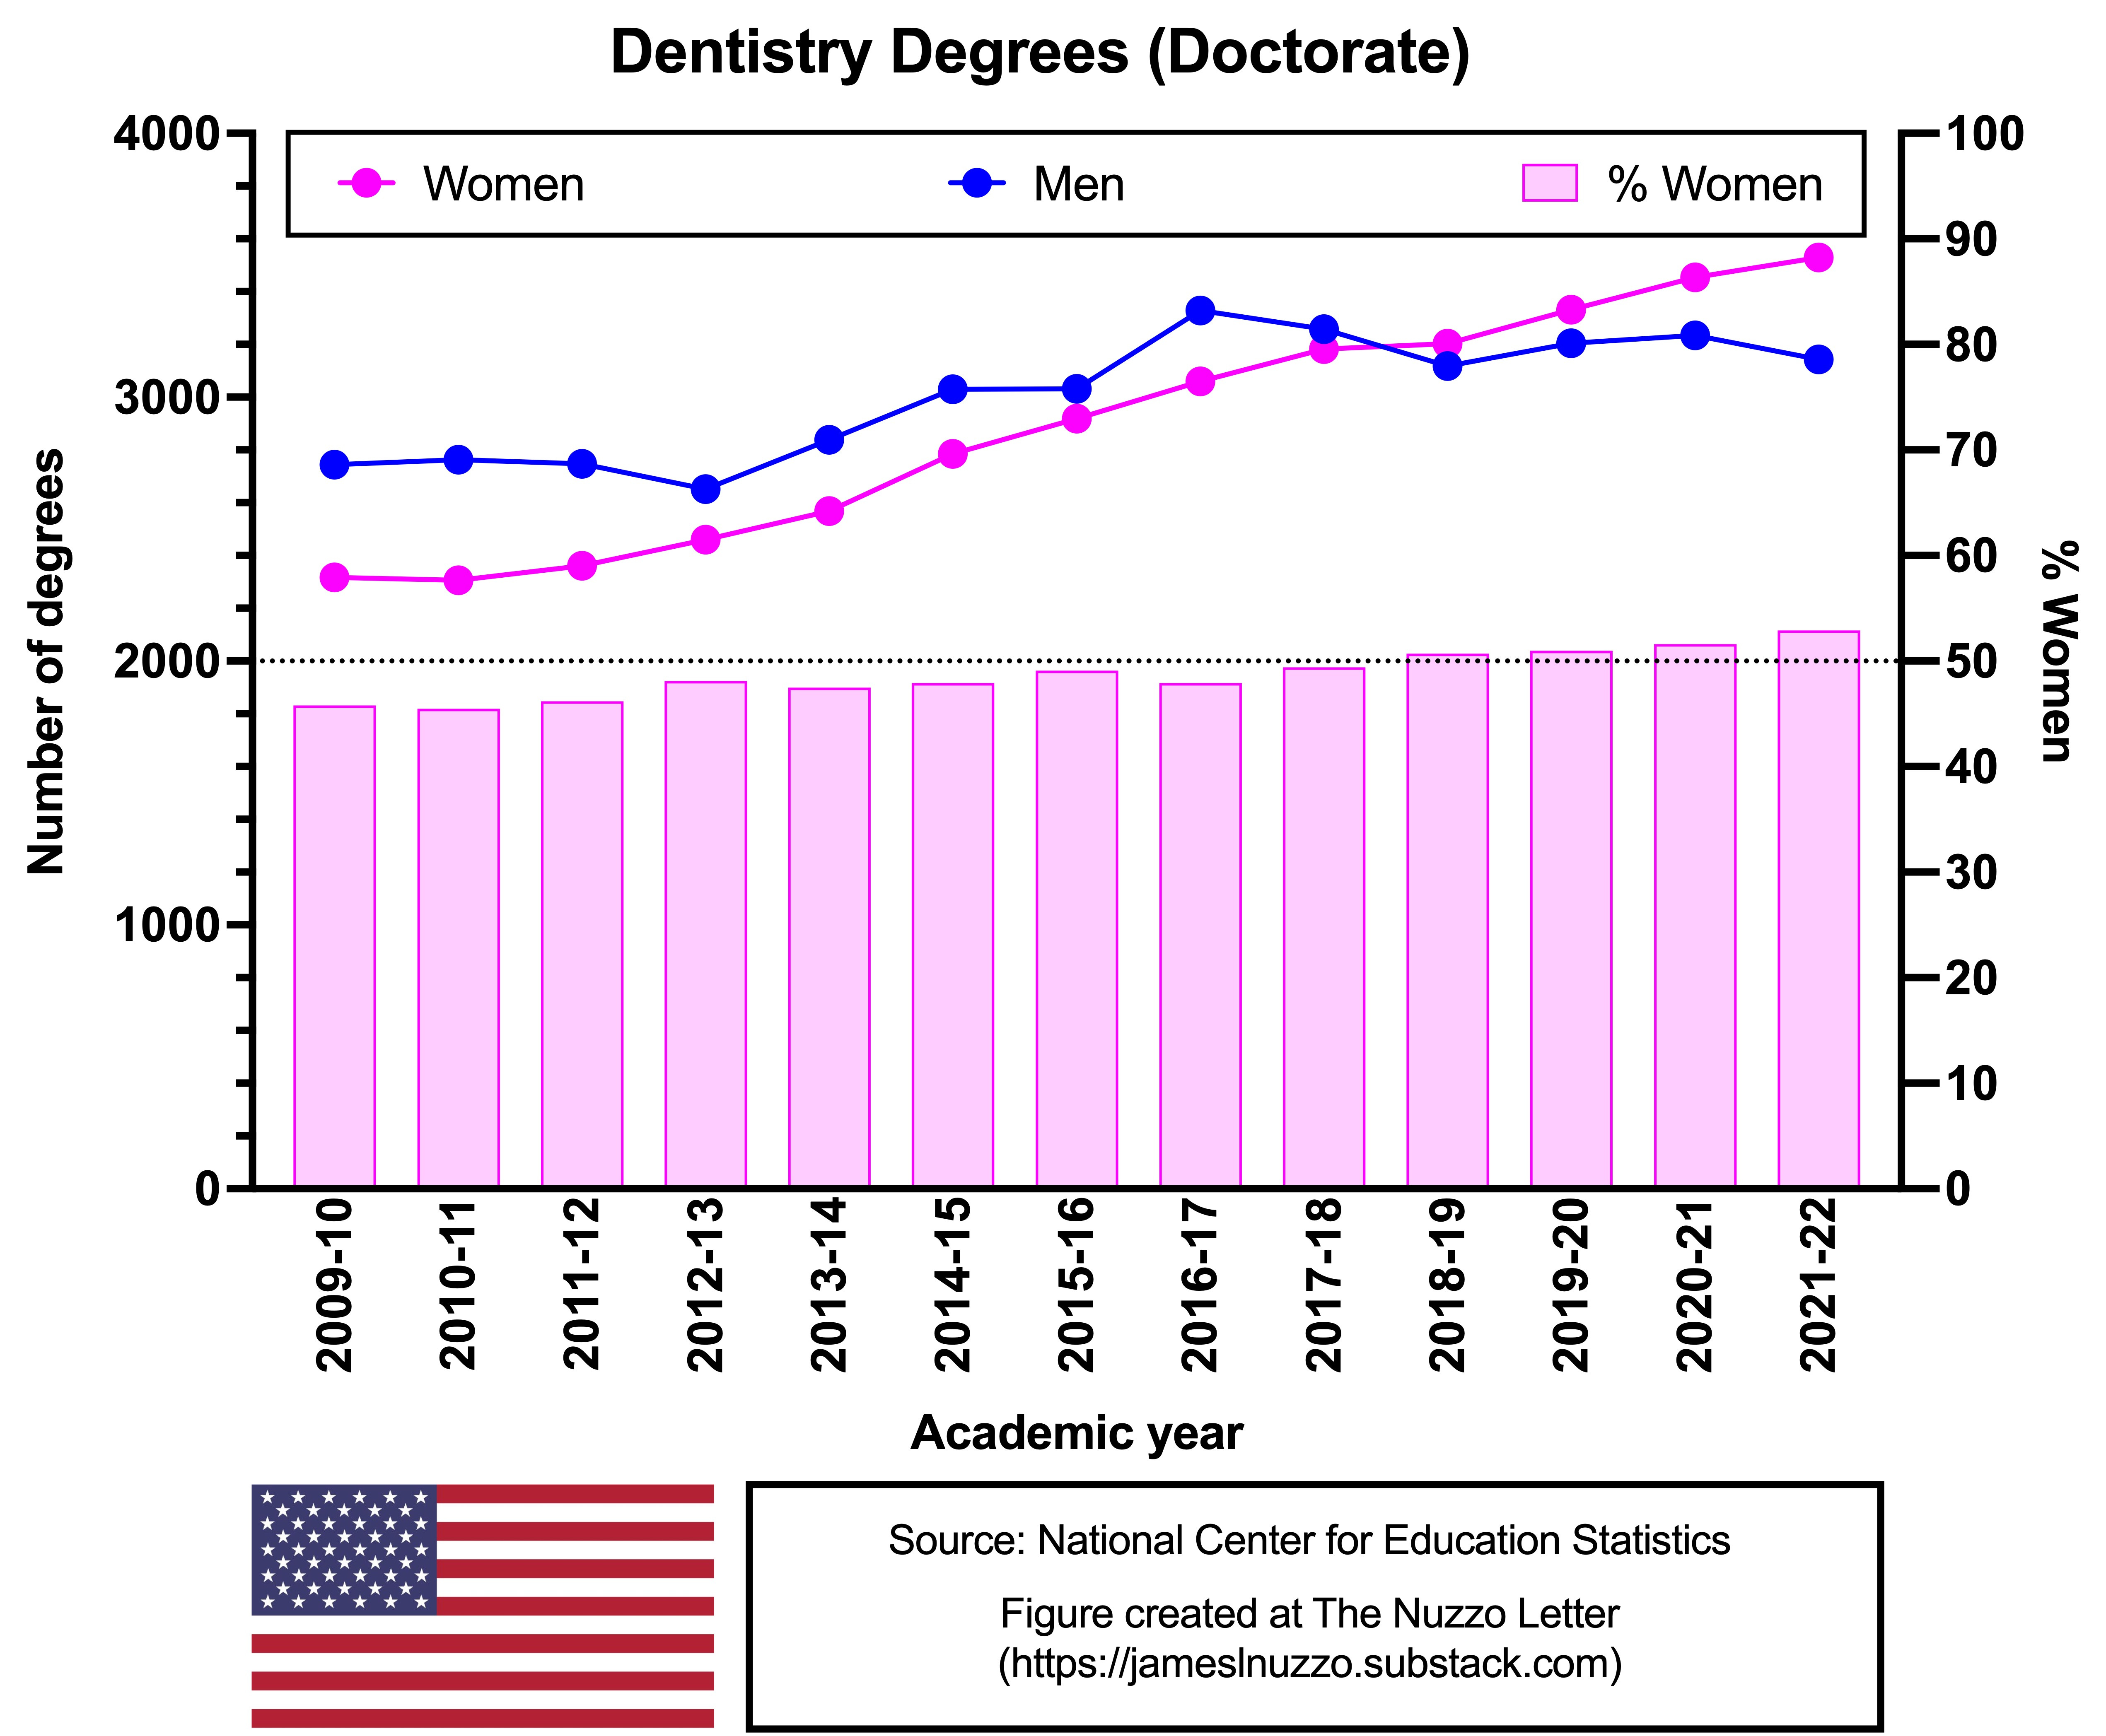
Dentistry
Since 2009-10, the sex difference in number of doctorate degrees earned in dentistry has been decreasing.
In 2018-19, for the first time, women surpassed men in doctorate degrees earned in dentistry.
In 2021-22, women comprised 53% of all doctorate degree earners in dentistry in the U.S.
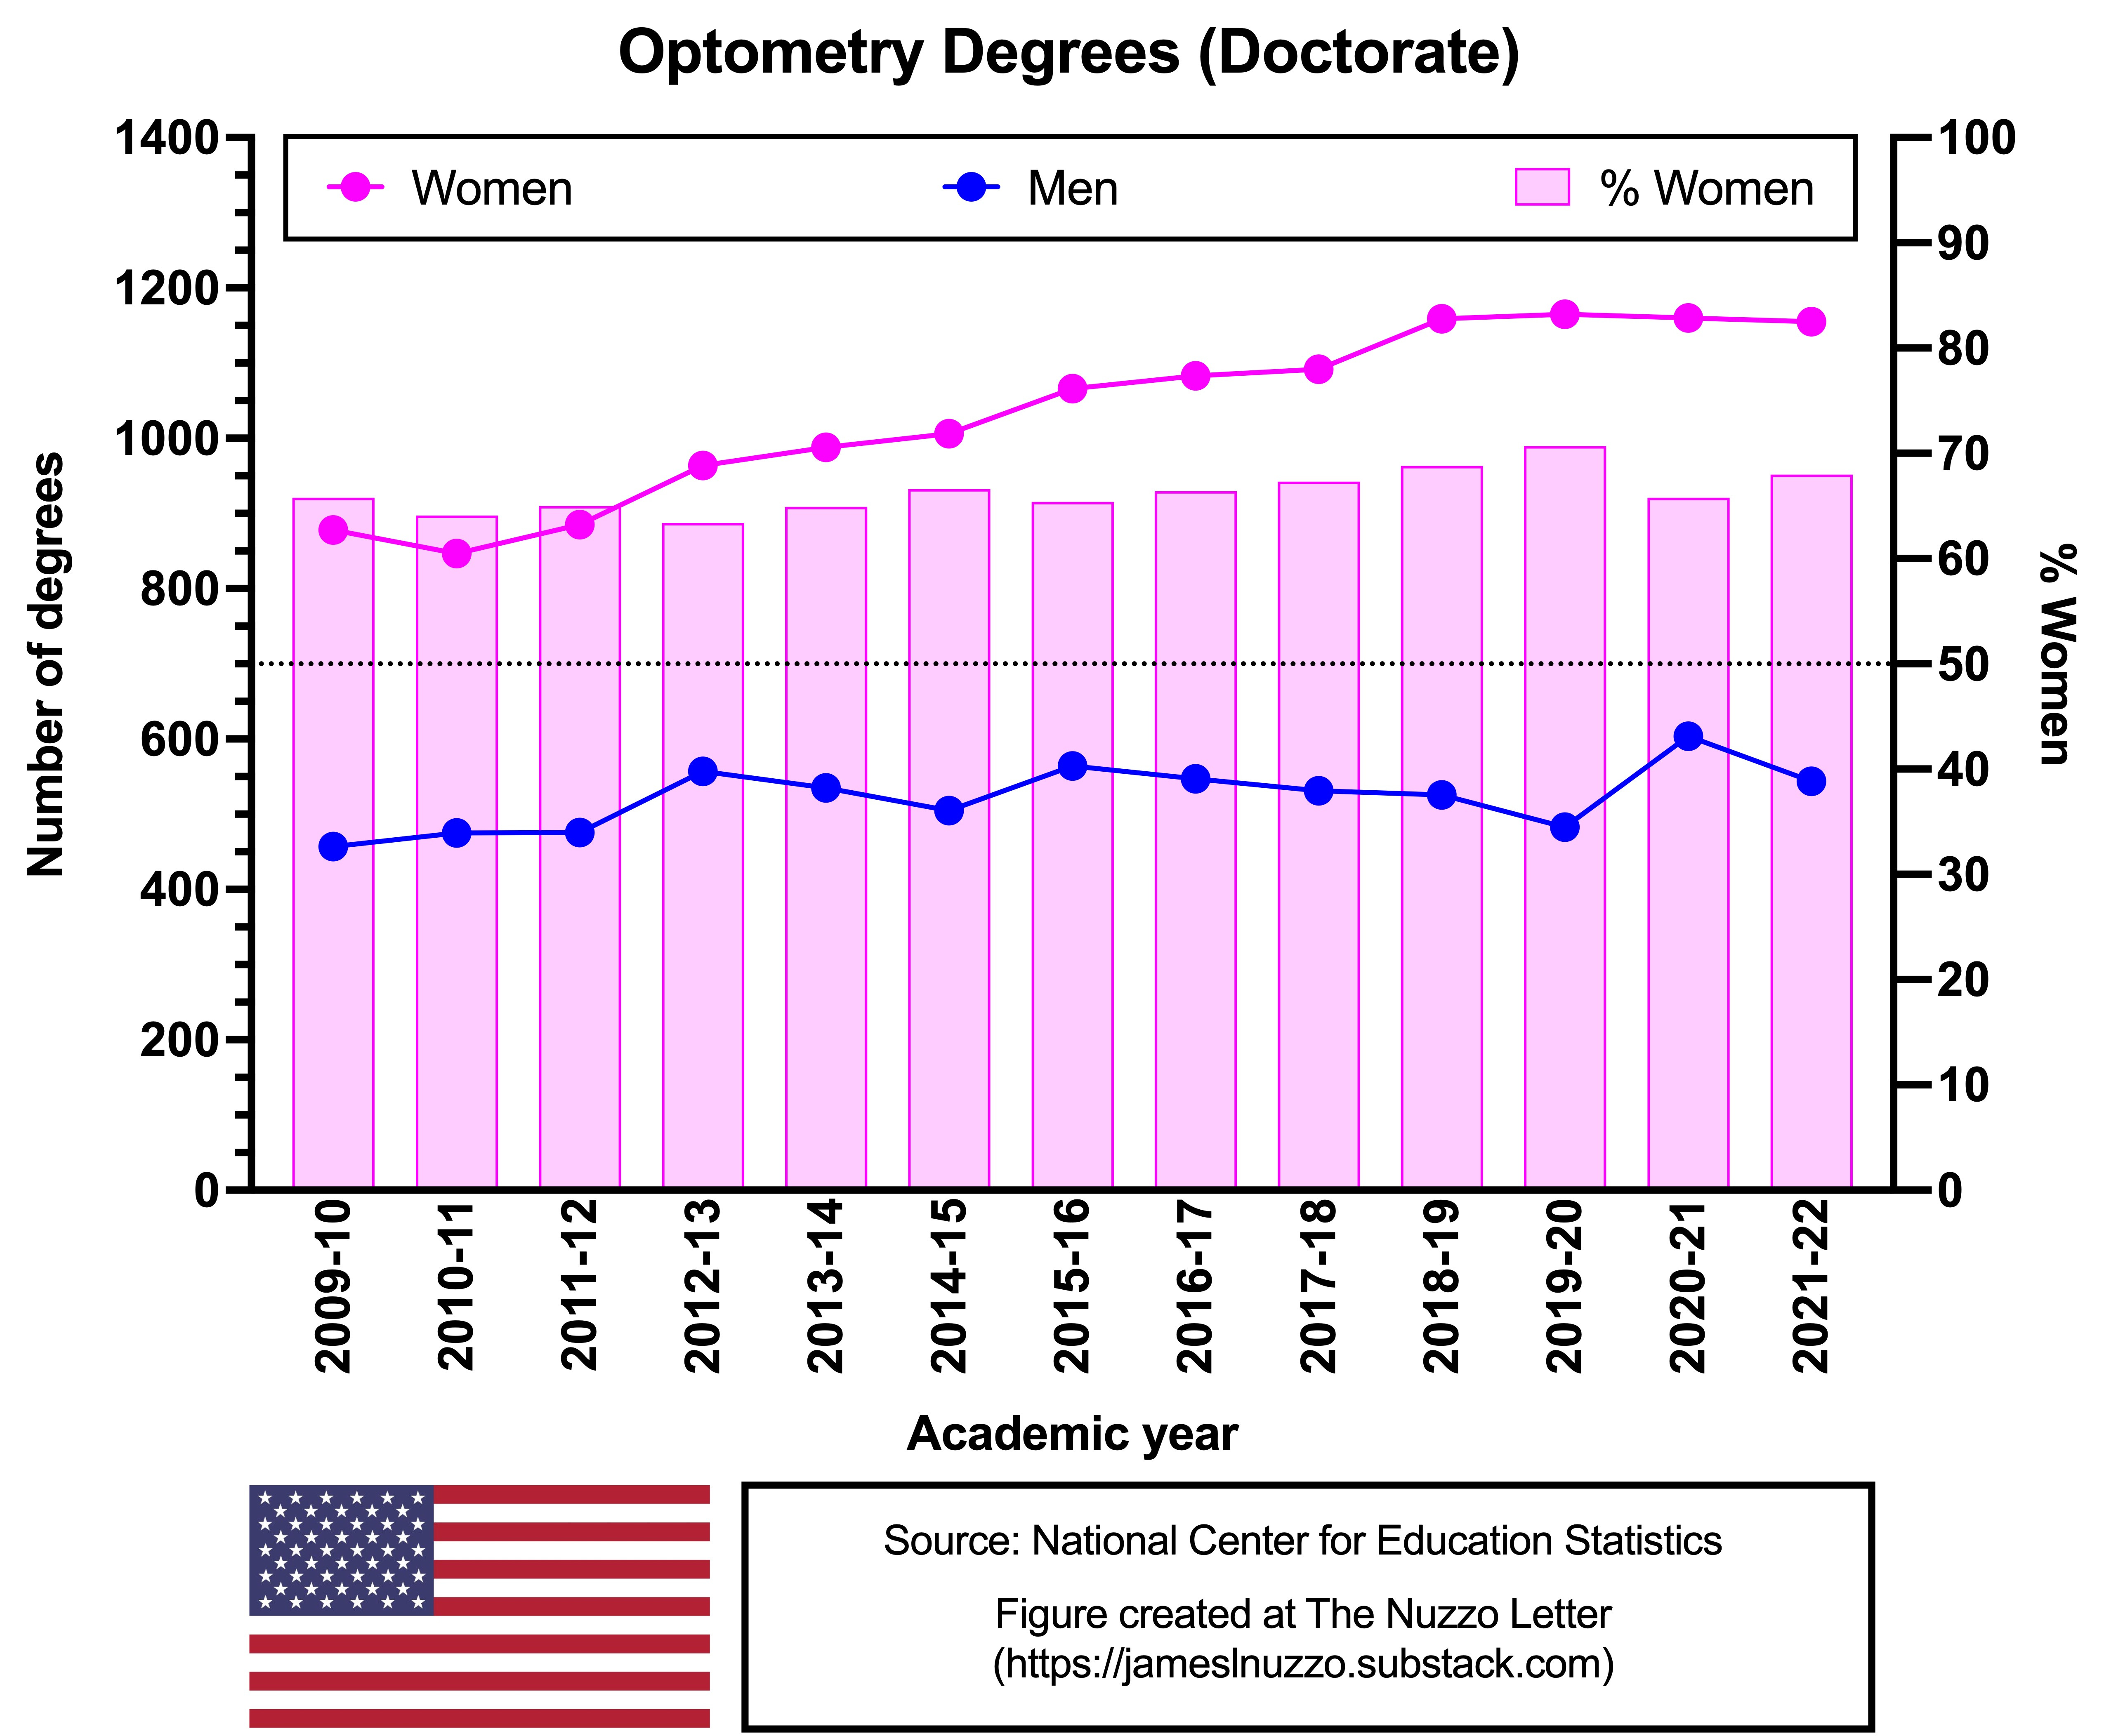
Optometry
Women are the majority of doctorate degree earners in optometry.
In 2021-22, women comprised 68% of all doctorate degree earners in optometry in the U.S.
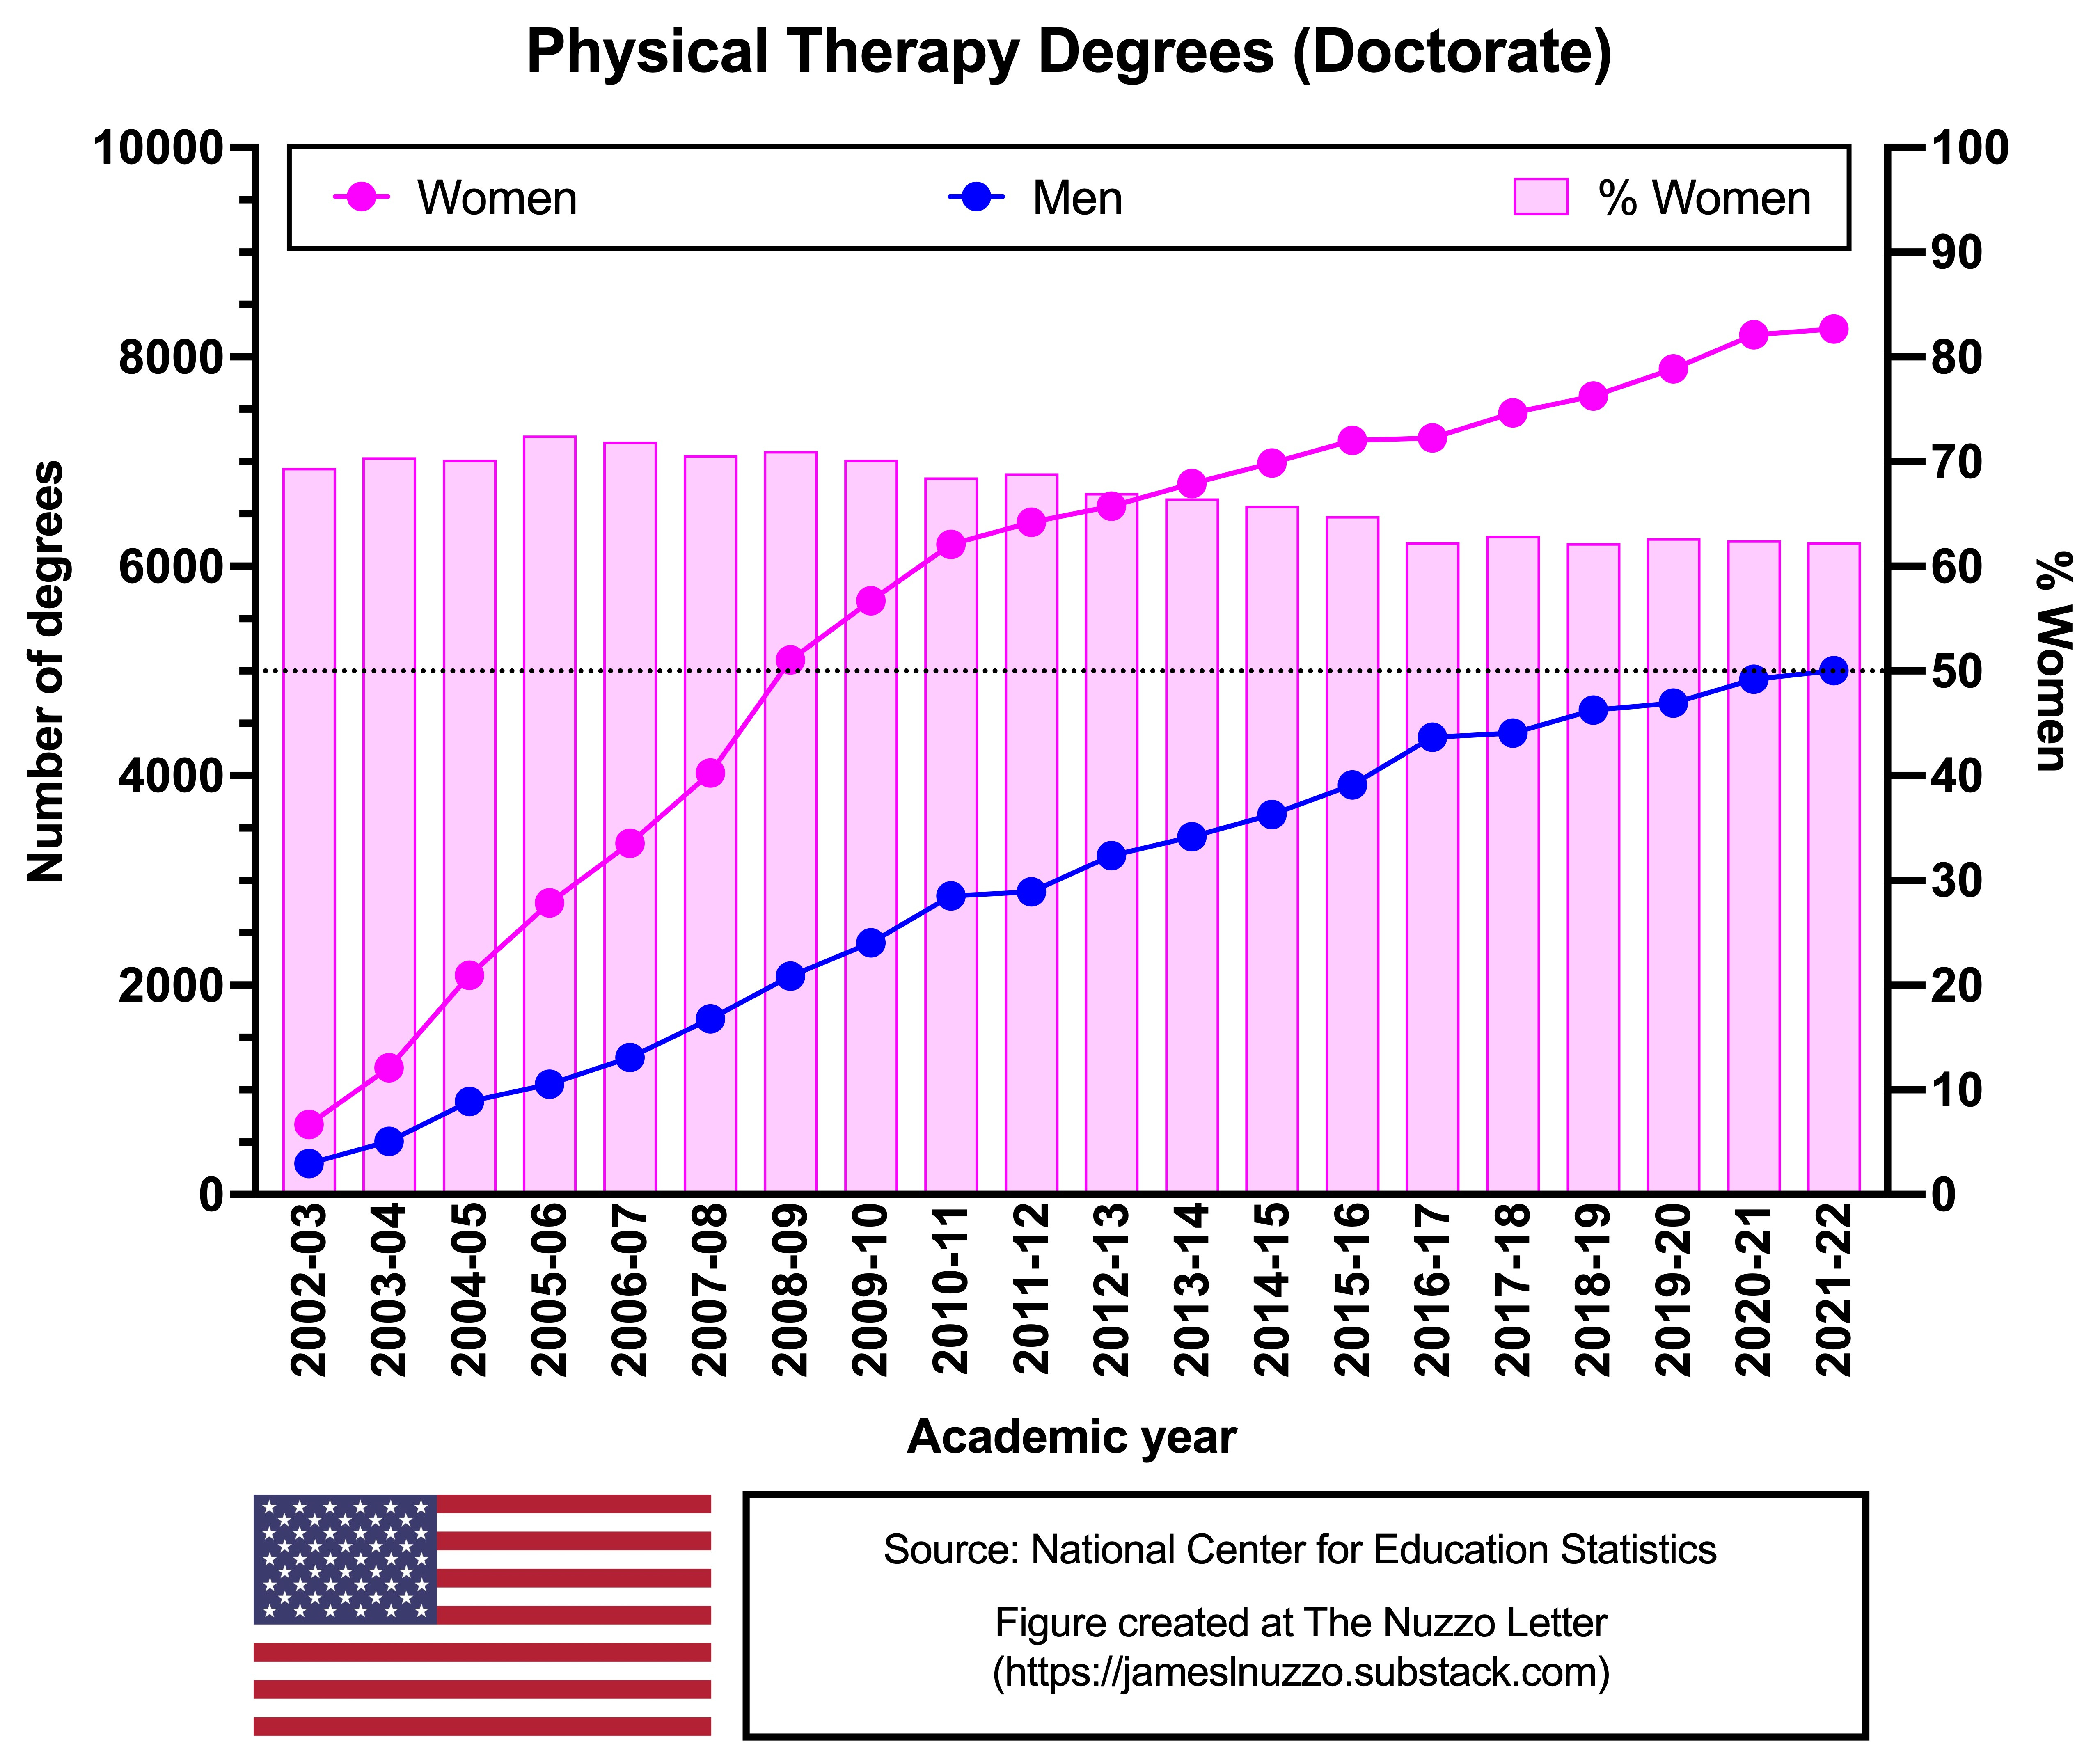
Physical Therapy
Women are the majority of doctorate degree earners in physical therapy.
In 2021-22, women comprised 62% of all doctorate degree earners in physical therapy in the U.S.
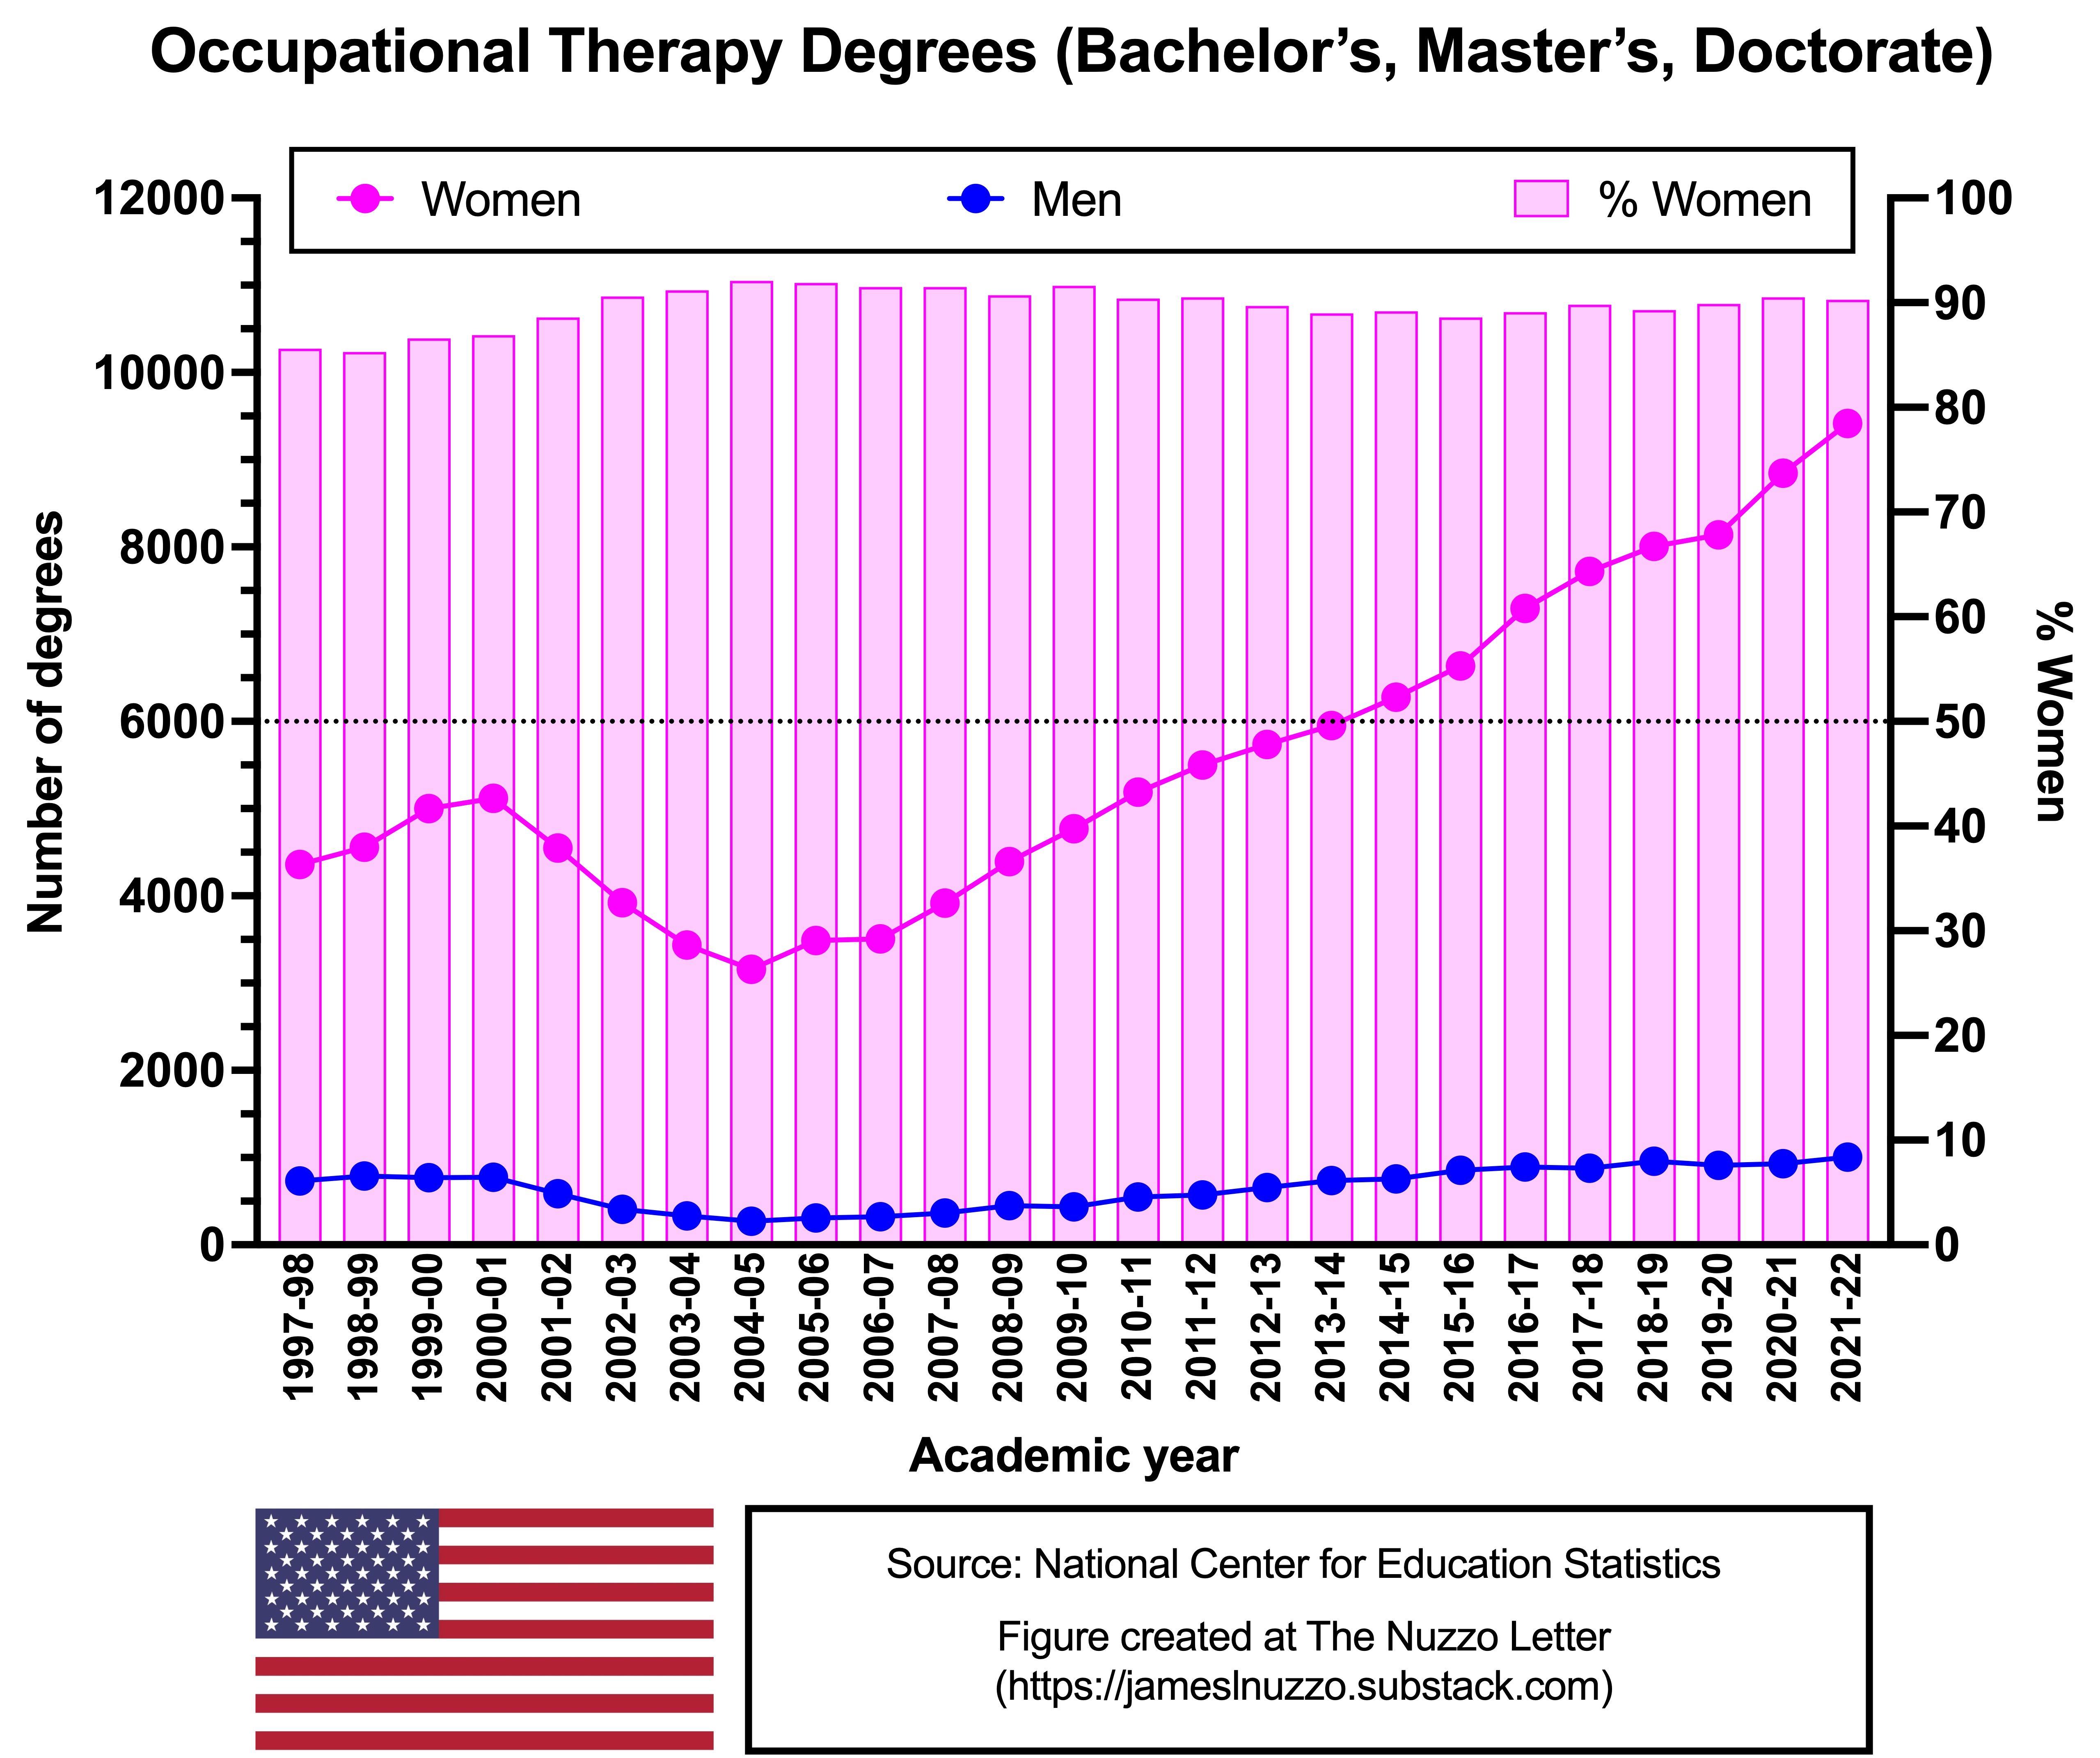
Occupational Therapy
Women are the majority of university degree earners in occupational therapy when all degree types are summed.
In 2021-22, women comprised 90% of all university degree earners in occupational therapy in the U.S.
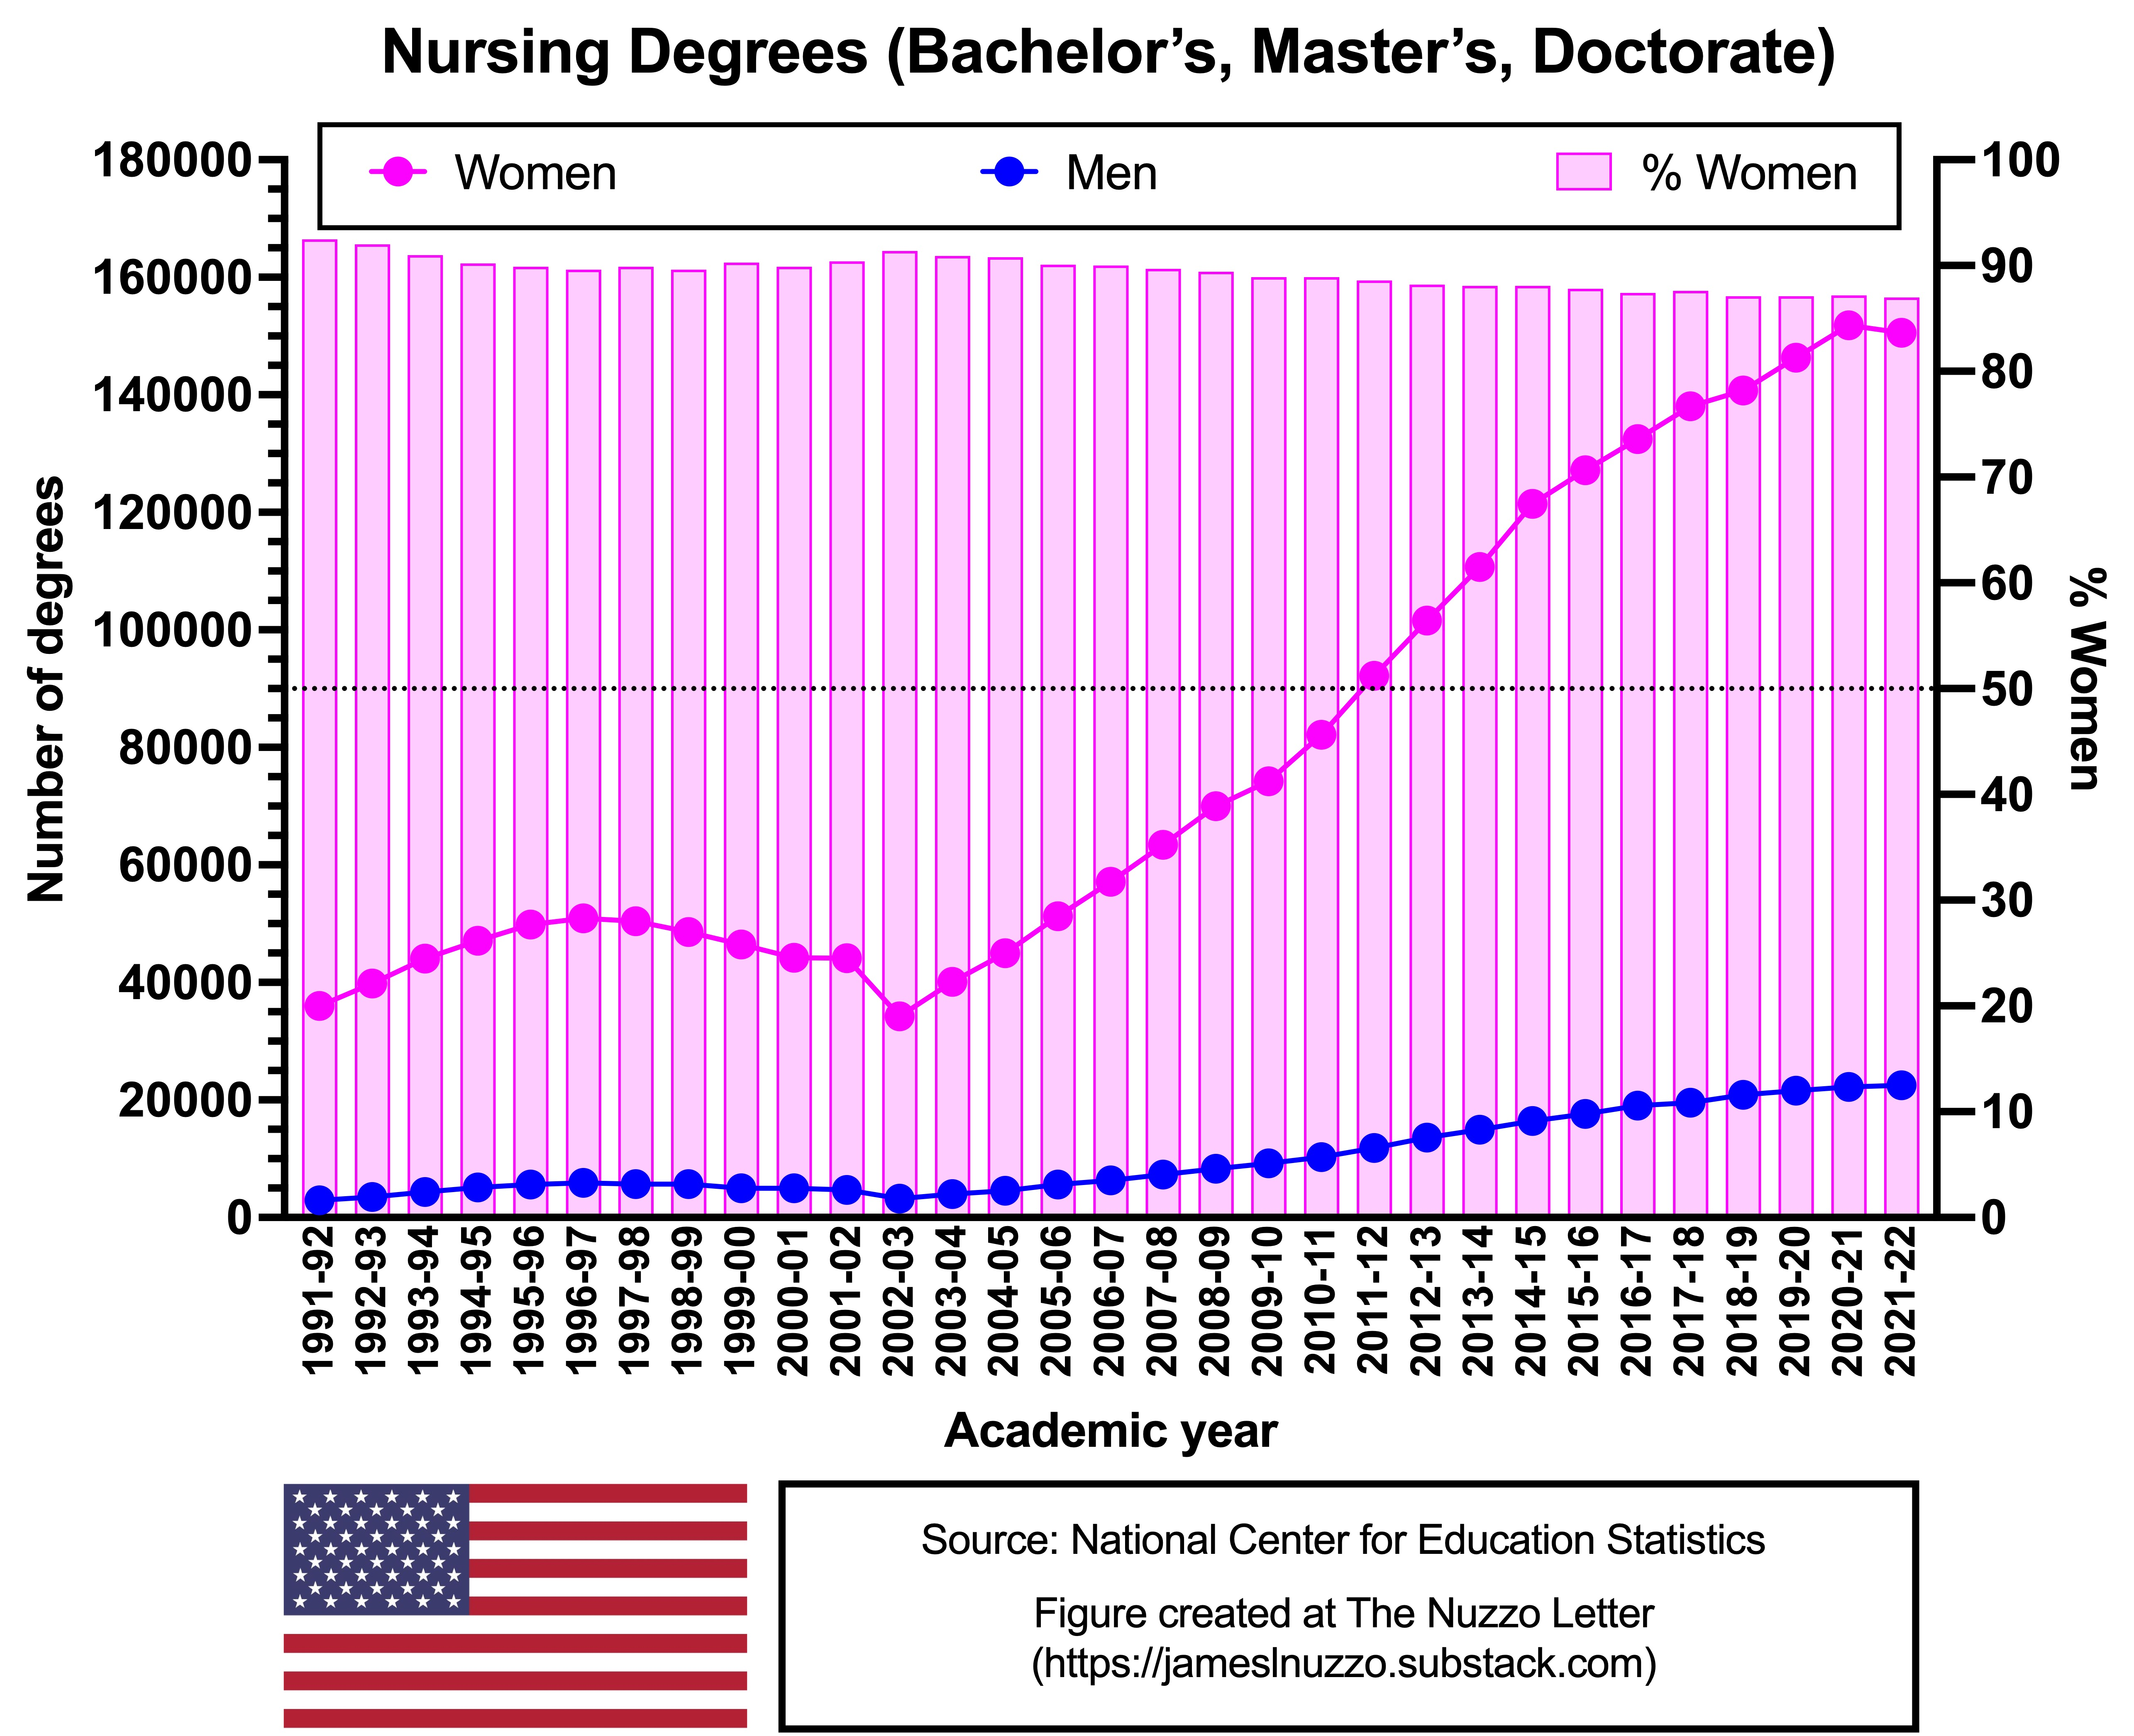
Nursing
Women are the majority of university degree earners in nursing when all degree types are summed.
In 2021-22, women comprised 87% of all university degree earners in nursing in the U.S.
Psychology
Women are the majority of university degree earners in psychology when all degree types are summed.
In 2021-22, women comprised 80% of all university degree earners in psychology in the U.S.

Bonus Commentary
The data in the graphs illustrate that women make up the majority of university graduates in health and medical fields in the U.S. In many of these fields, women are over 75% of graduates.
Greater proportions of female than male graduates in health and medical fields are due, in part, to sex differences in vocational interests. Women are more typically more interested in various health topics than are men, and women are more likely than men to prefer working with people than things. However, other factors also contribute to fewer men than women earning university degrees. Below is a list of some of these factors, which were published previously at The Nuzzo Letter.
1. Males have lower high school grade point averages than do females, and this will negatively impact the ability of males to get admitted into a university;
2. Males have higher high school dropout rates than do females, and this will negatively impact the ability of males to get admitted into a university;
3. Males have poorer readings skills than females;
4. Males have poorer writing abilities than females;
5. Fewer initiatives exist for increasing male university enrolment. For example, “women in STEM” initiatives are common, but initiatives for “men in psychology,” “men in nursing,” “men in occupational therapy,” and “men in early childhood education” are practically non-existent
6. Less financial aid and sex-specific scholarships are offered to men than women
7. Men might believe that they are better off financially by entering the workforce directly after high school rather than spending money on a postsecondary education.
University officials and their allies in the media and not-for-profit sector have expressed little concern about fewer men than women undertaking and completing a university education. Instead, their sex-specific attention and resources have focused on increasing the number of women in science, technology, engineering, and mathematics (STEM) fields, with an underlying rationale that greater male than female representation in STEM fields is problematic for those fields and for society at-large. Interestingly, this same “representation problem” is rarely applied to fields where women outnumber men. Yet, such a rationale can be argued based on what is known about sex differences in personality, beliefs, and behaviors. For example, due to female in-group bias, the substantially larger female than male presence in government public health jobs, might be a factor that contributes to health policies consistently allocating more funds to women’s than men’s causes. Moreover, the substantially larger female than male presence in public health likely played a role in the excessive safetyism and censorship that occurred during the COVID-19 pandemic. As Janice Fiamengo observed, “the Covid pandemic was in various ways a distinctively female public-health event, powered by women’s preoccupation with safety and insisting on conformity. I could feel that female energy whenever I was in public or turned on the TV news: the aggressive do-gooderism, the simpering voices, the frowning alertness to any form of skepticism or lack of vigilance.”
A relative lack of male graduates in the field of psychology is also a potential issue that typically receives little attention. Men typically do not express a preference for the sex of their psychologist. Nevertheless, some men prefer a male psychologist. But finding one will be difficult. Numbers of male psychology graduates plateaued many years ago in the U.S., and one recent account from a male student who dropped out of a clinical psychology course illustrates why some men are currently disinclined to study psychology.
Related Content at The Nuzzo Letter


SUPPORT THE NUZZO LETTER
If you appreciated this content, please consider supporting The Nuzzo Letter with a one-time or recurring donation. Your support is greatly appreciated. It helps me to continue to work on independent research projects and fight for my evidence-based discourse. To donate, click the DonorBox logo. In two simple steps, you can donate using ApplePay, PayPal, or another service. Thank you!

If you'd like more data, here are the top 10 BS degrees, by percentage, for males and females: https://briefedbydata.substack.com/p/female-vs-male-undergraduate-enrollment
Similar data for MS degrees: https://briefedbydata.substack.com/p/female-vs-male-masters-degree-enrollment
Generally speaking, female-dominated majors have more females than male-dominated majors have males.
Love this.