


Sex Differences in U.S. Voting
Graph of the Week

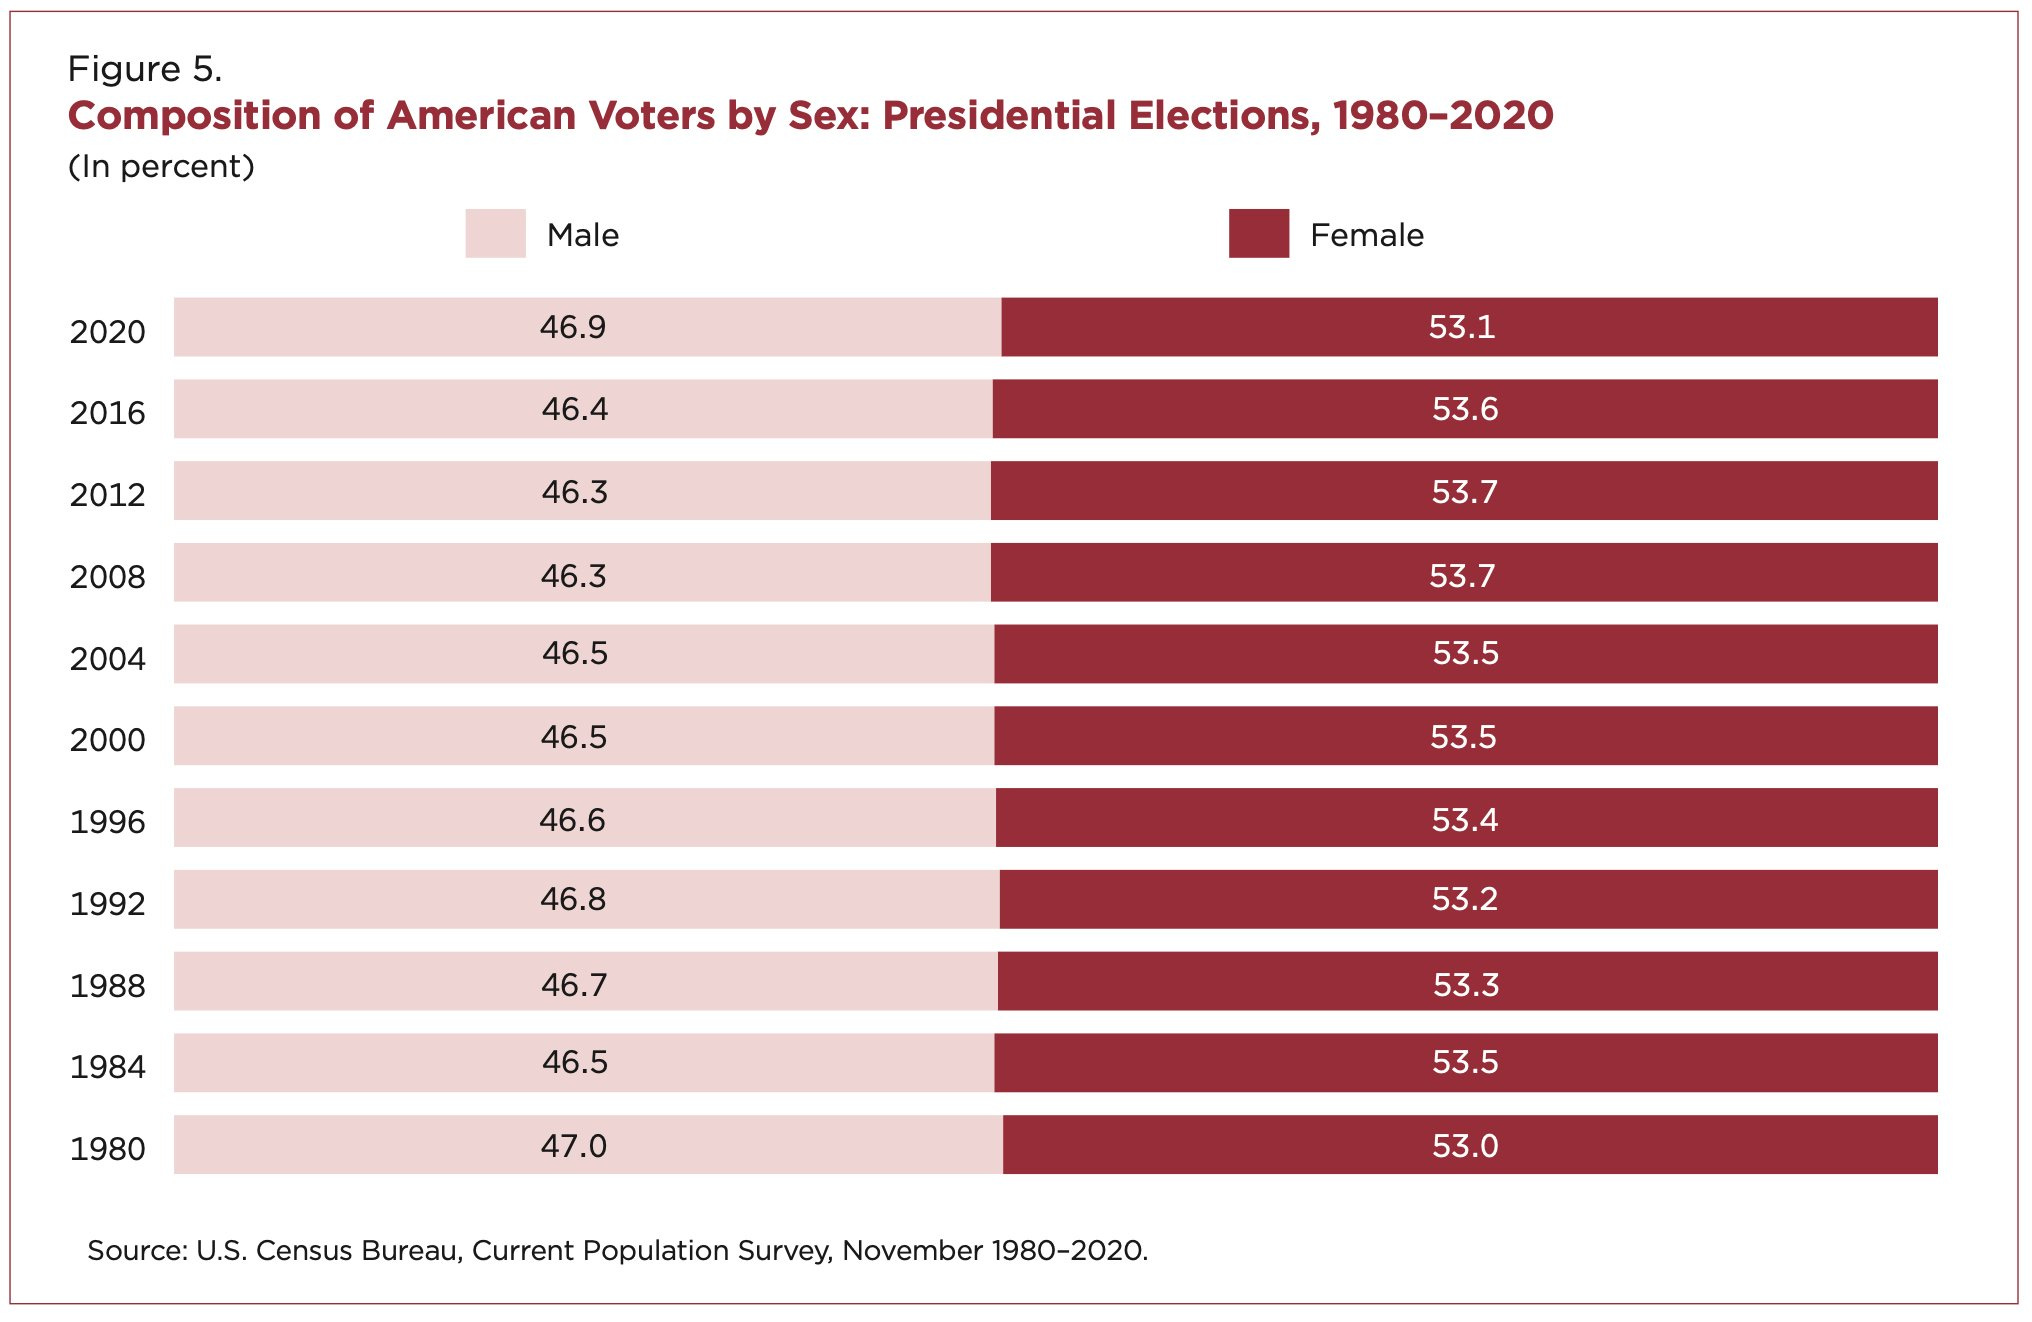
This week’s graphs illustrate the number and proportion of United States (U.S.) voters in presidential elections who are men and women.
Key Points
Since 1964, a greater number of women than men have voted in elections for U.S. president.

Each year, since at least 1980, women have made up about 53-54% of voters for U.S. president, whereas men have made up about 46-47% of voters.
In 2020, about 68% of the total female population voted compared to 65% of the total male population. Approximately one third of the U.S. population chooses not to vote in elections for president each year.

Sources
Center for American Women and Politics. Gender Differences in Voter Turnout. 2024.
Fabina J, Scherer Z. “Voting and Registration in the Election of November 2020,” Current Population Survey Reports, P20-585, U.S. Census Bureau, Washington, DC, 2022.
Bonus Commentary
The above data show that fewer men than women in the U.S. vote in presidential election. This sex difference has consequences on election results because men and women, on average, differ in their views about what the role of government ought to be. Women tend to lean more to the political left, desiring more government involvement in daily life, whereas men tend to lean more to the political right, desiring less government involvement in daily life. Reasons for men’s lower voter turnout have been explored here at The Nuzzo Letter. Interestingly, lower male than female voter turnout is also observed in Australia – a country in which voting is compulsory.
Related Content at The Nuzzo Letter


SUPPORT THE NUZZO LETTER
If you appreciated this content, please consider supporting The Nuzzo Letter with a one-time or recurring donation. Your support is greatly appreciated. It helps me to continue to work on independent research projects and fight for my evidence-based discourse. To donate, click the DonorBox logo. In two simple steps, you can donate using ApplePay, PayPal, or another service. Thank you!
