


Sex of University Staff
Graph of the Week

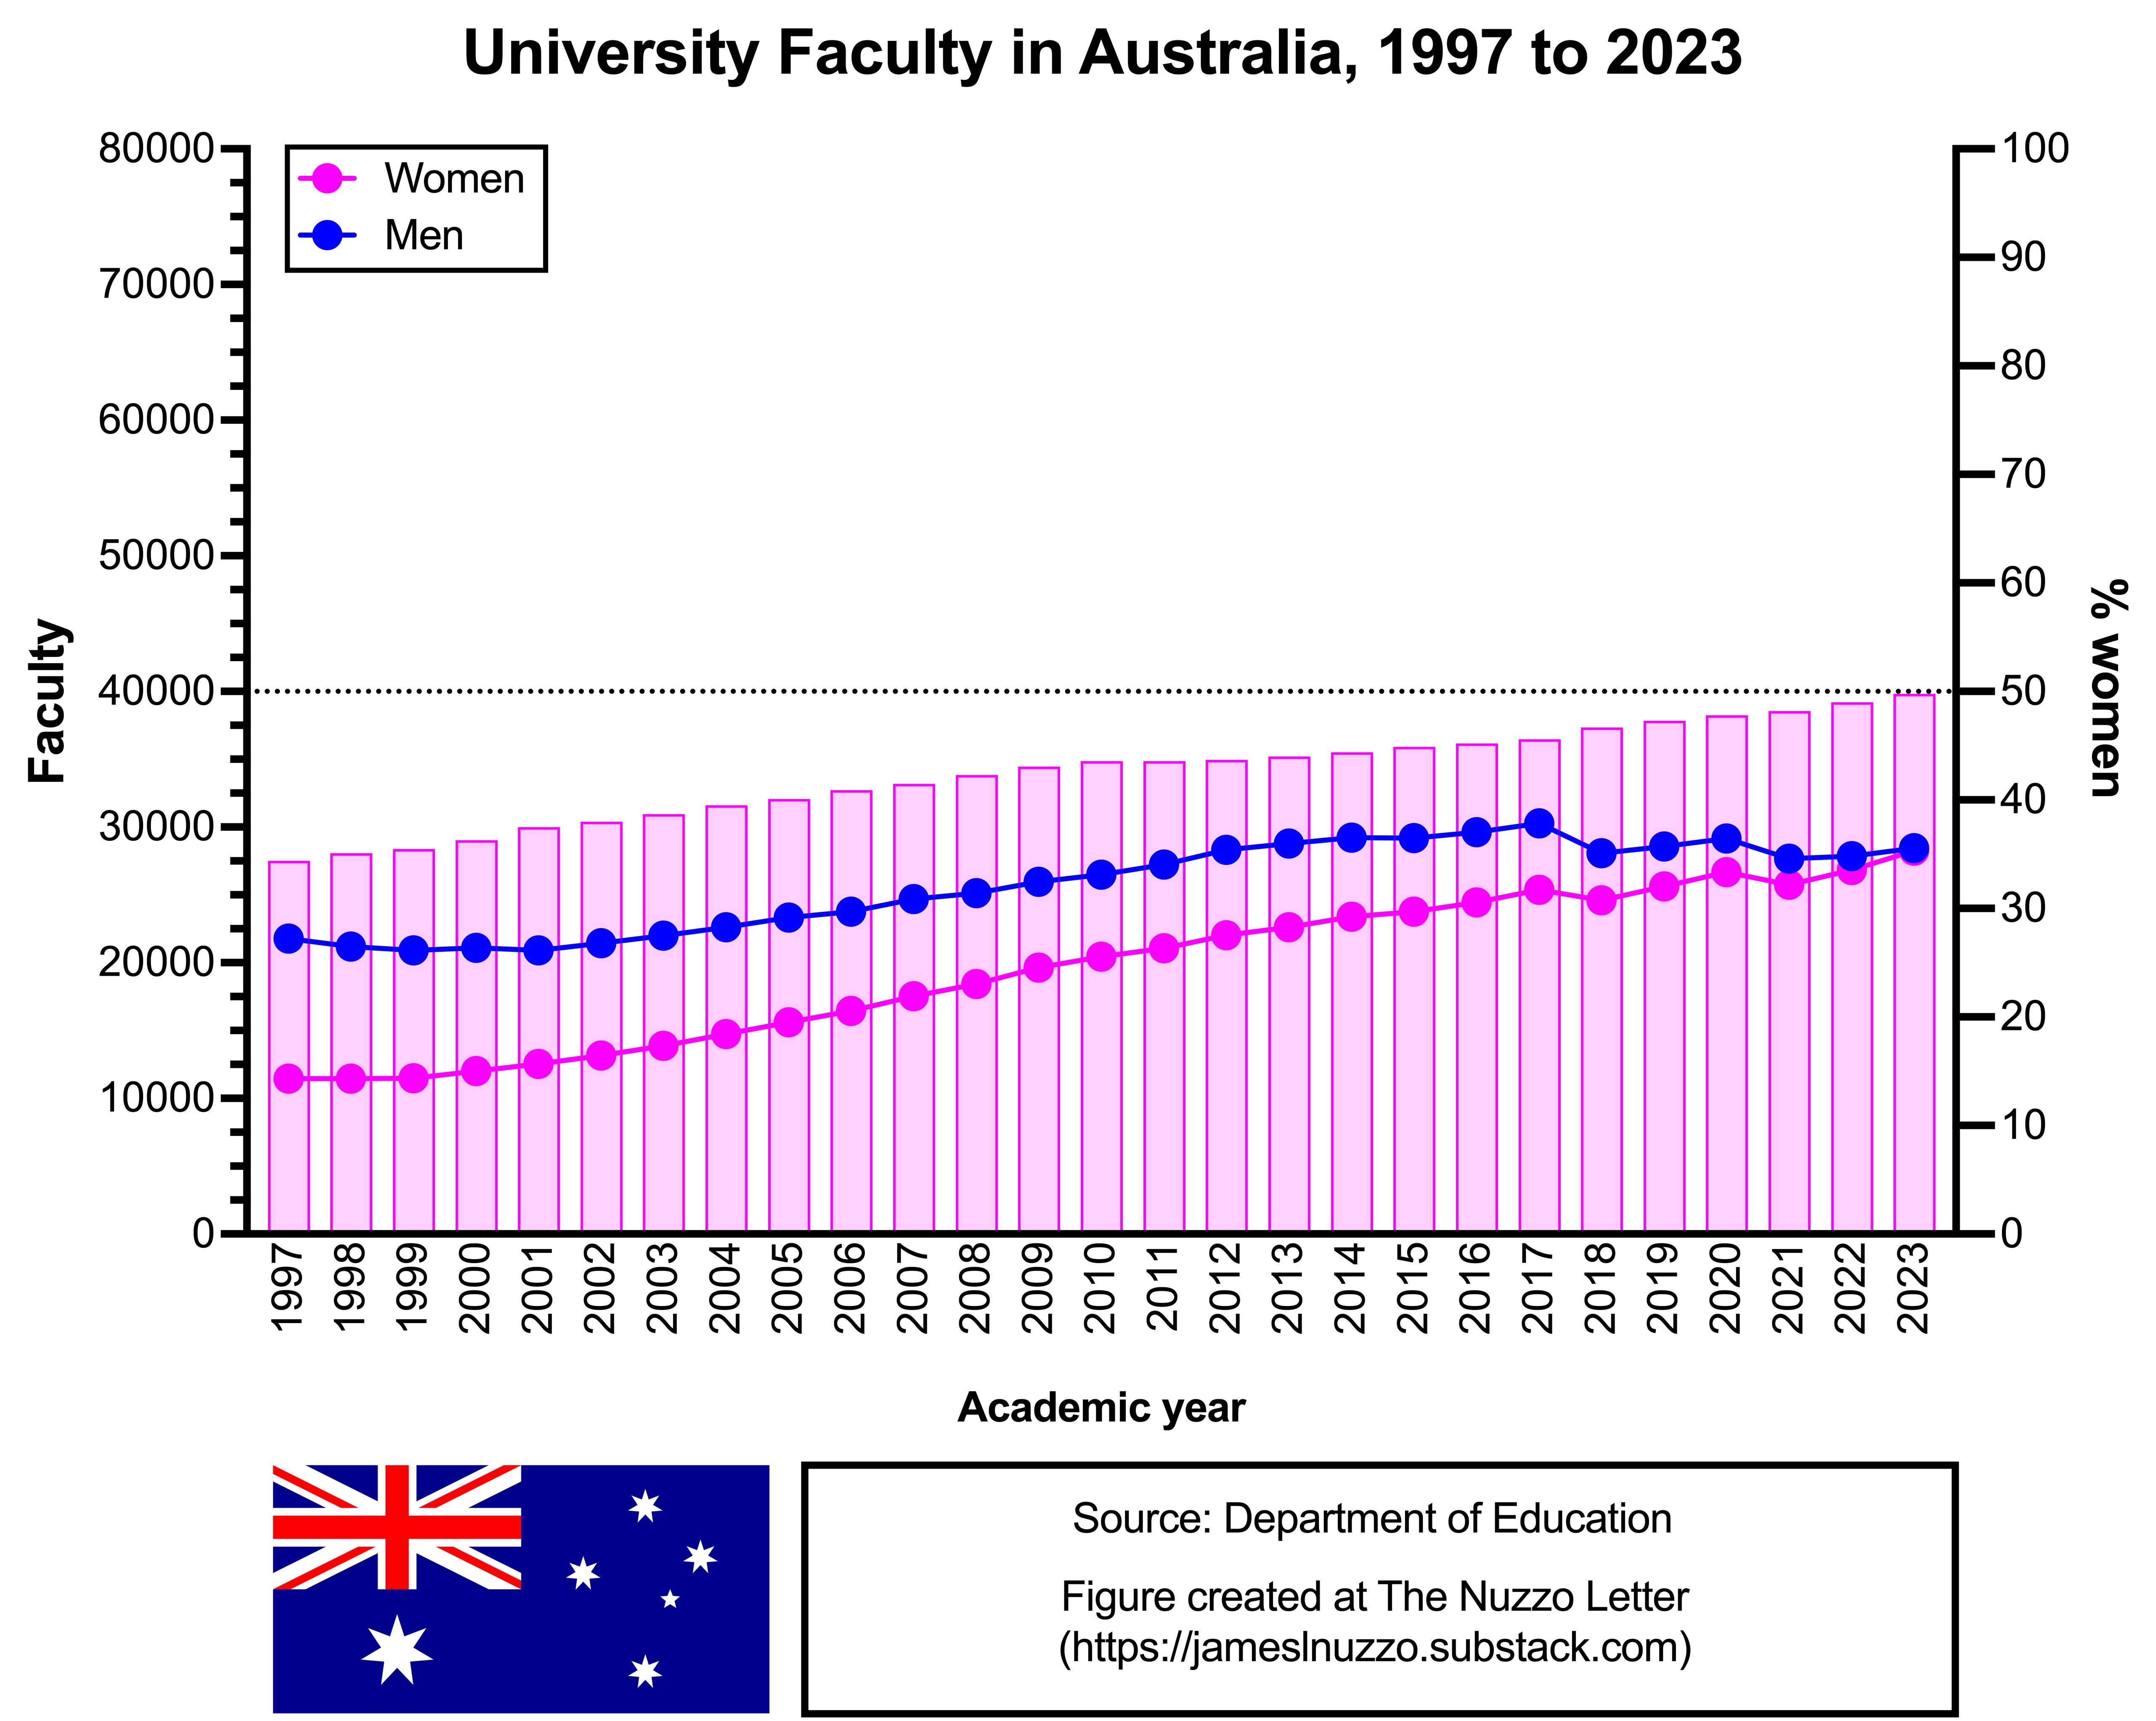
This week’s graphs show numbers of male and female staff (faculty and non-academic staff) at universities in Australia, Canada, and the United States (U.S.). The left y-axis is the number of staff and is associated with the blue and pink lines. The right y-axis is the percent of staff positions filled by women and is associated with pink bars.
AUSTRALIA
The first graph shows the annual number of male and female faculty members at universities in Australia from 1997 to 2023. Male faculty have outnumbered female faculty throughout Australian’s higher education history. However, the size of this sex difference has narrowed consistently over time, with 34.4% of faculty as female in 1997 and 49.8% of faculty as female in 2023.
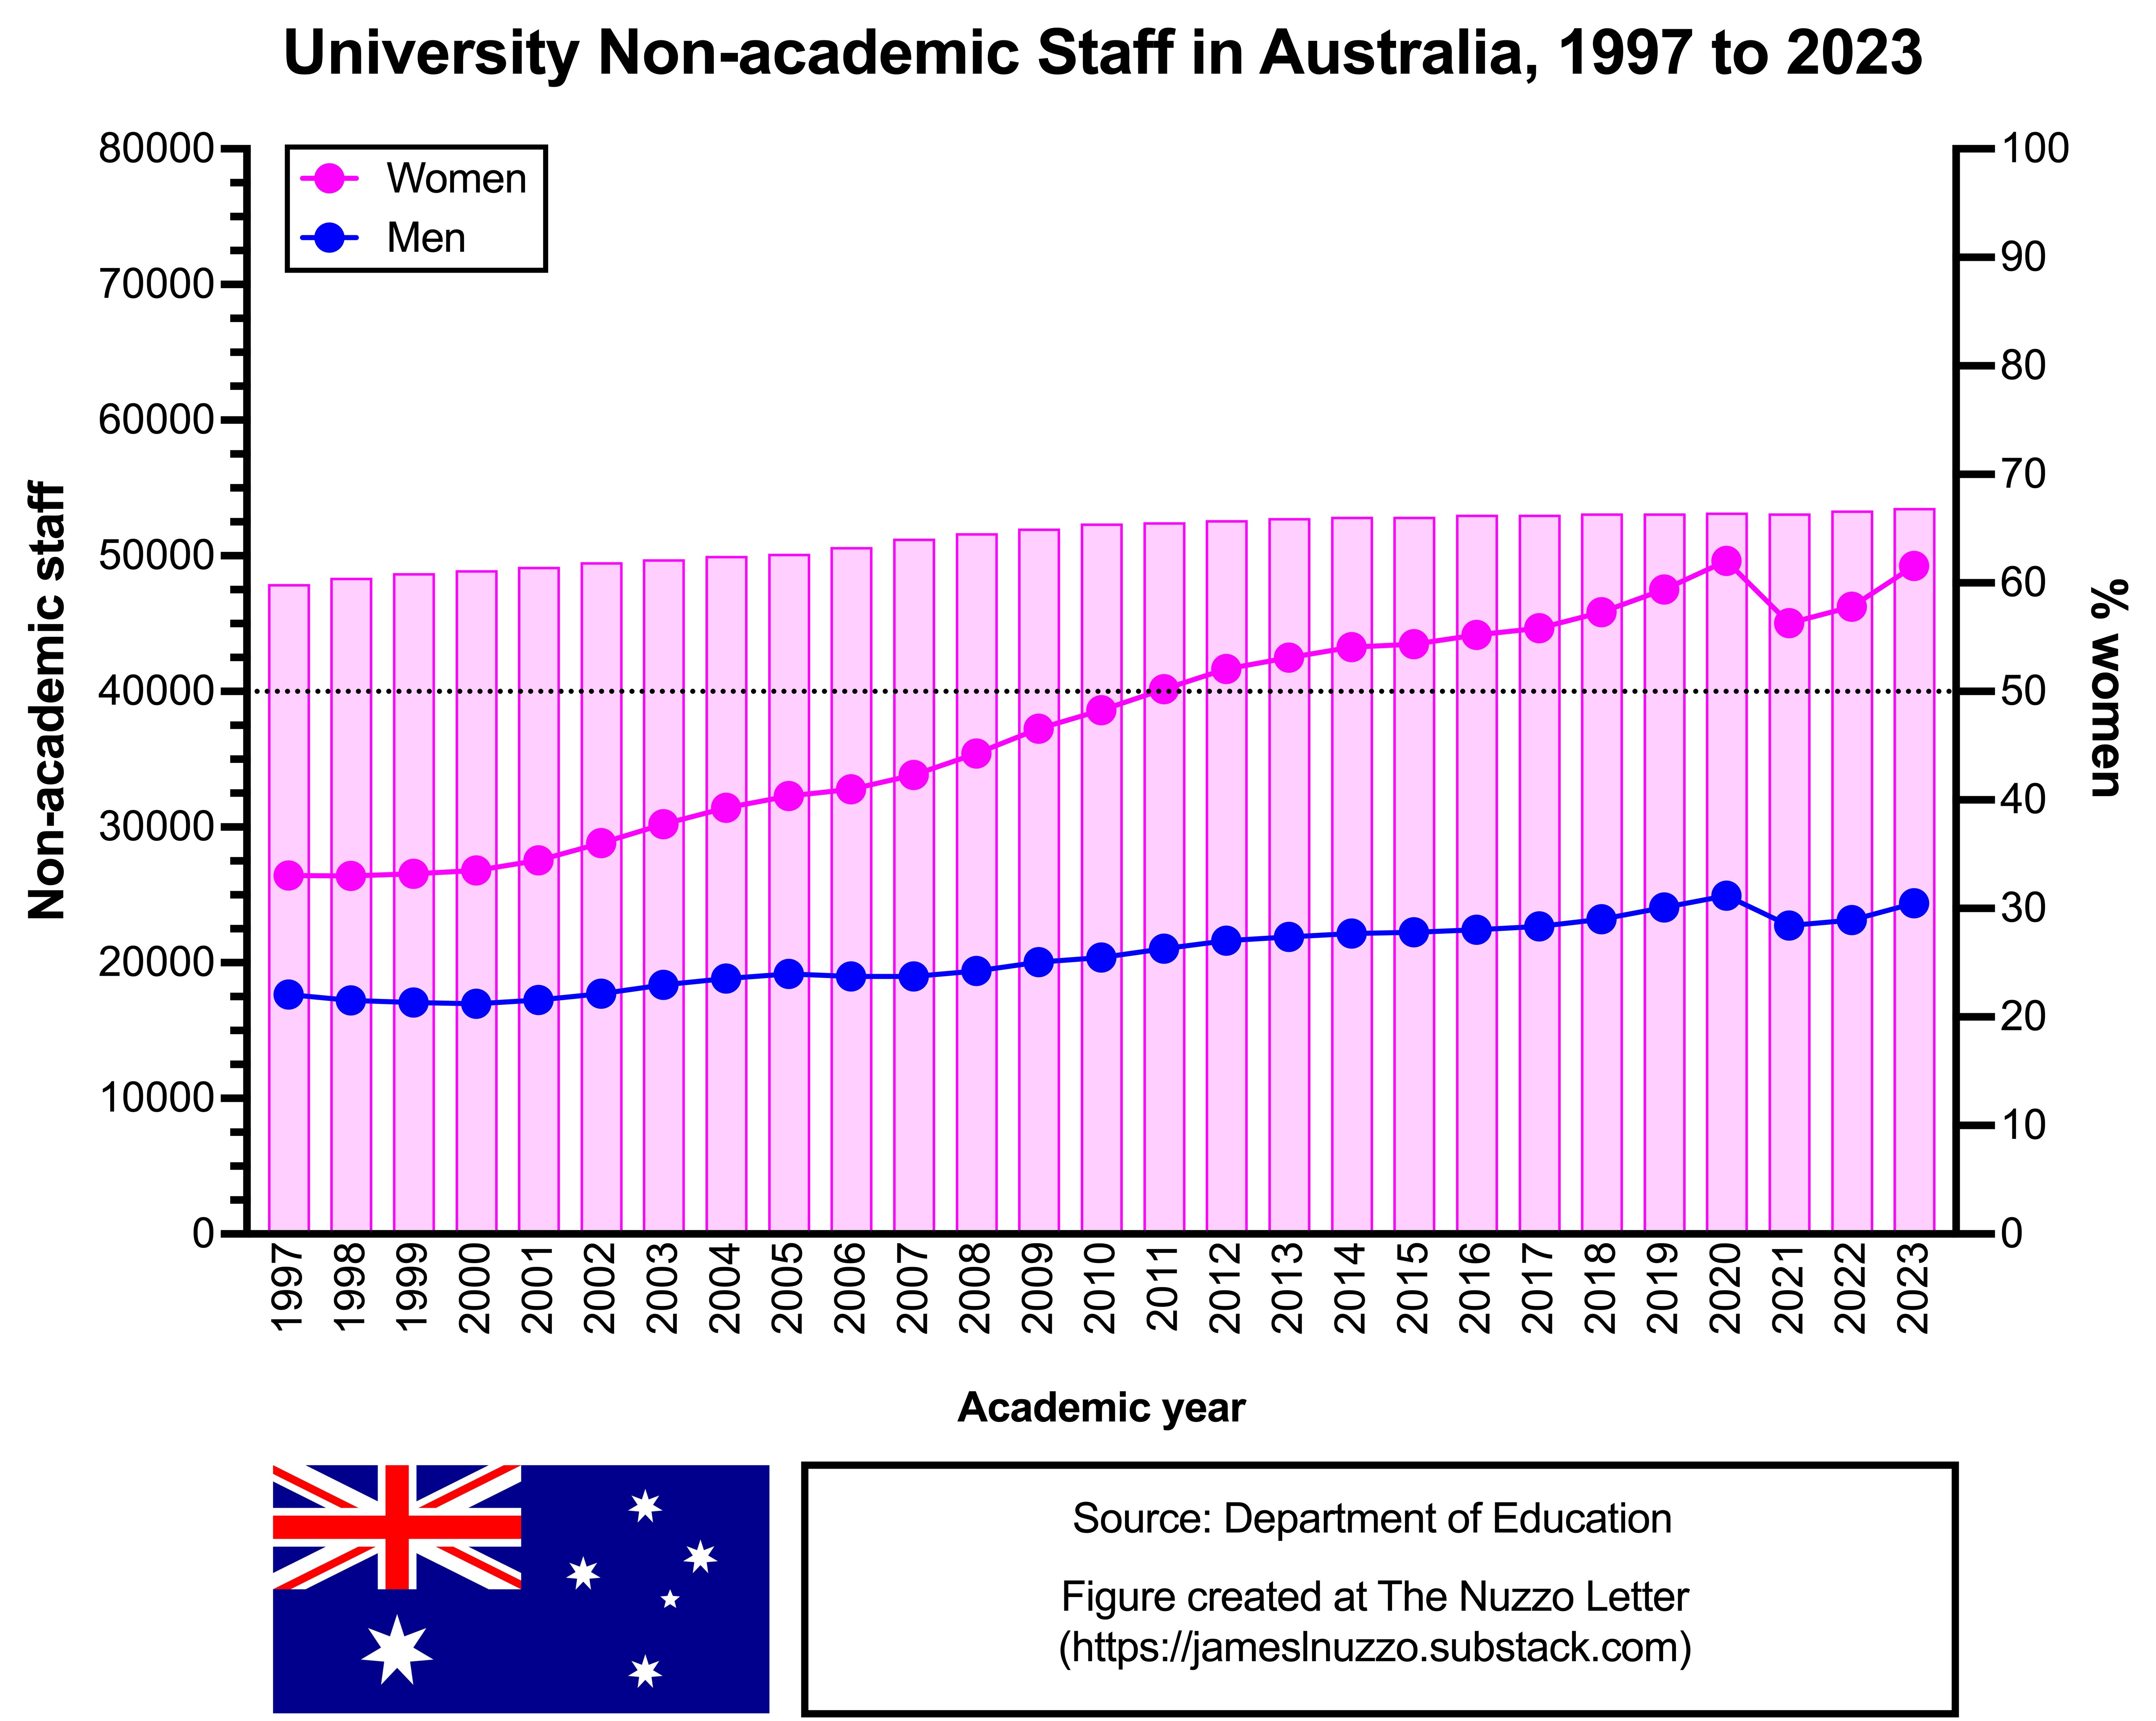
The second graph shows the annual number of male and female non-academic staff at universities in Australia from 1997 to 2023. Women have made up a greater proportion of non-academic staff at universities in Australia for many years, and this sex difference has increased over time. In 1997, women made up 59.9% of non-academic staff at universities in Australia. In 2023, women made up 66.9% of non-academic staff at universities in Australia.
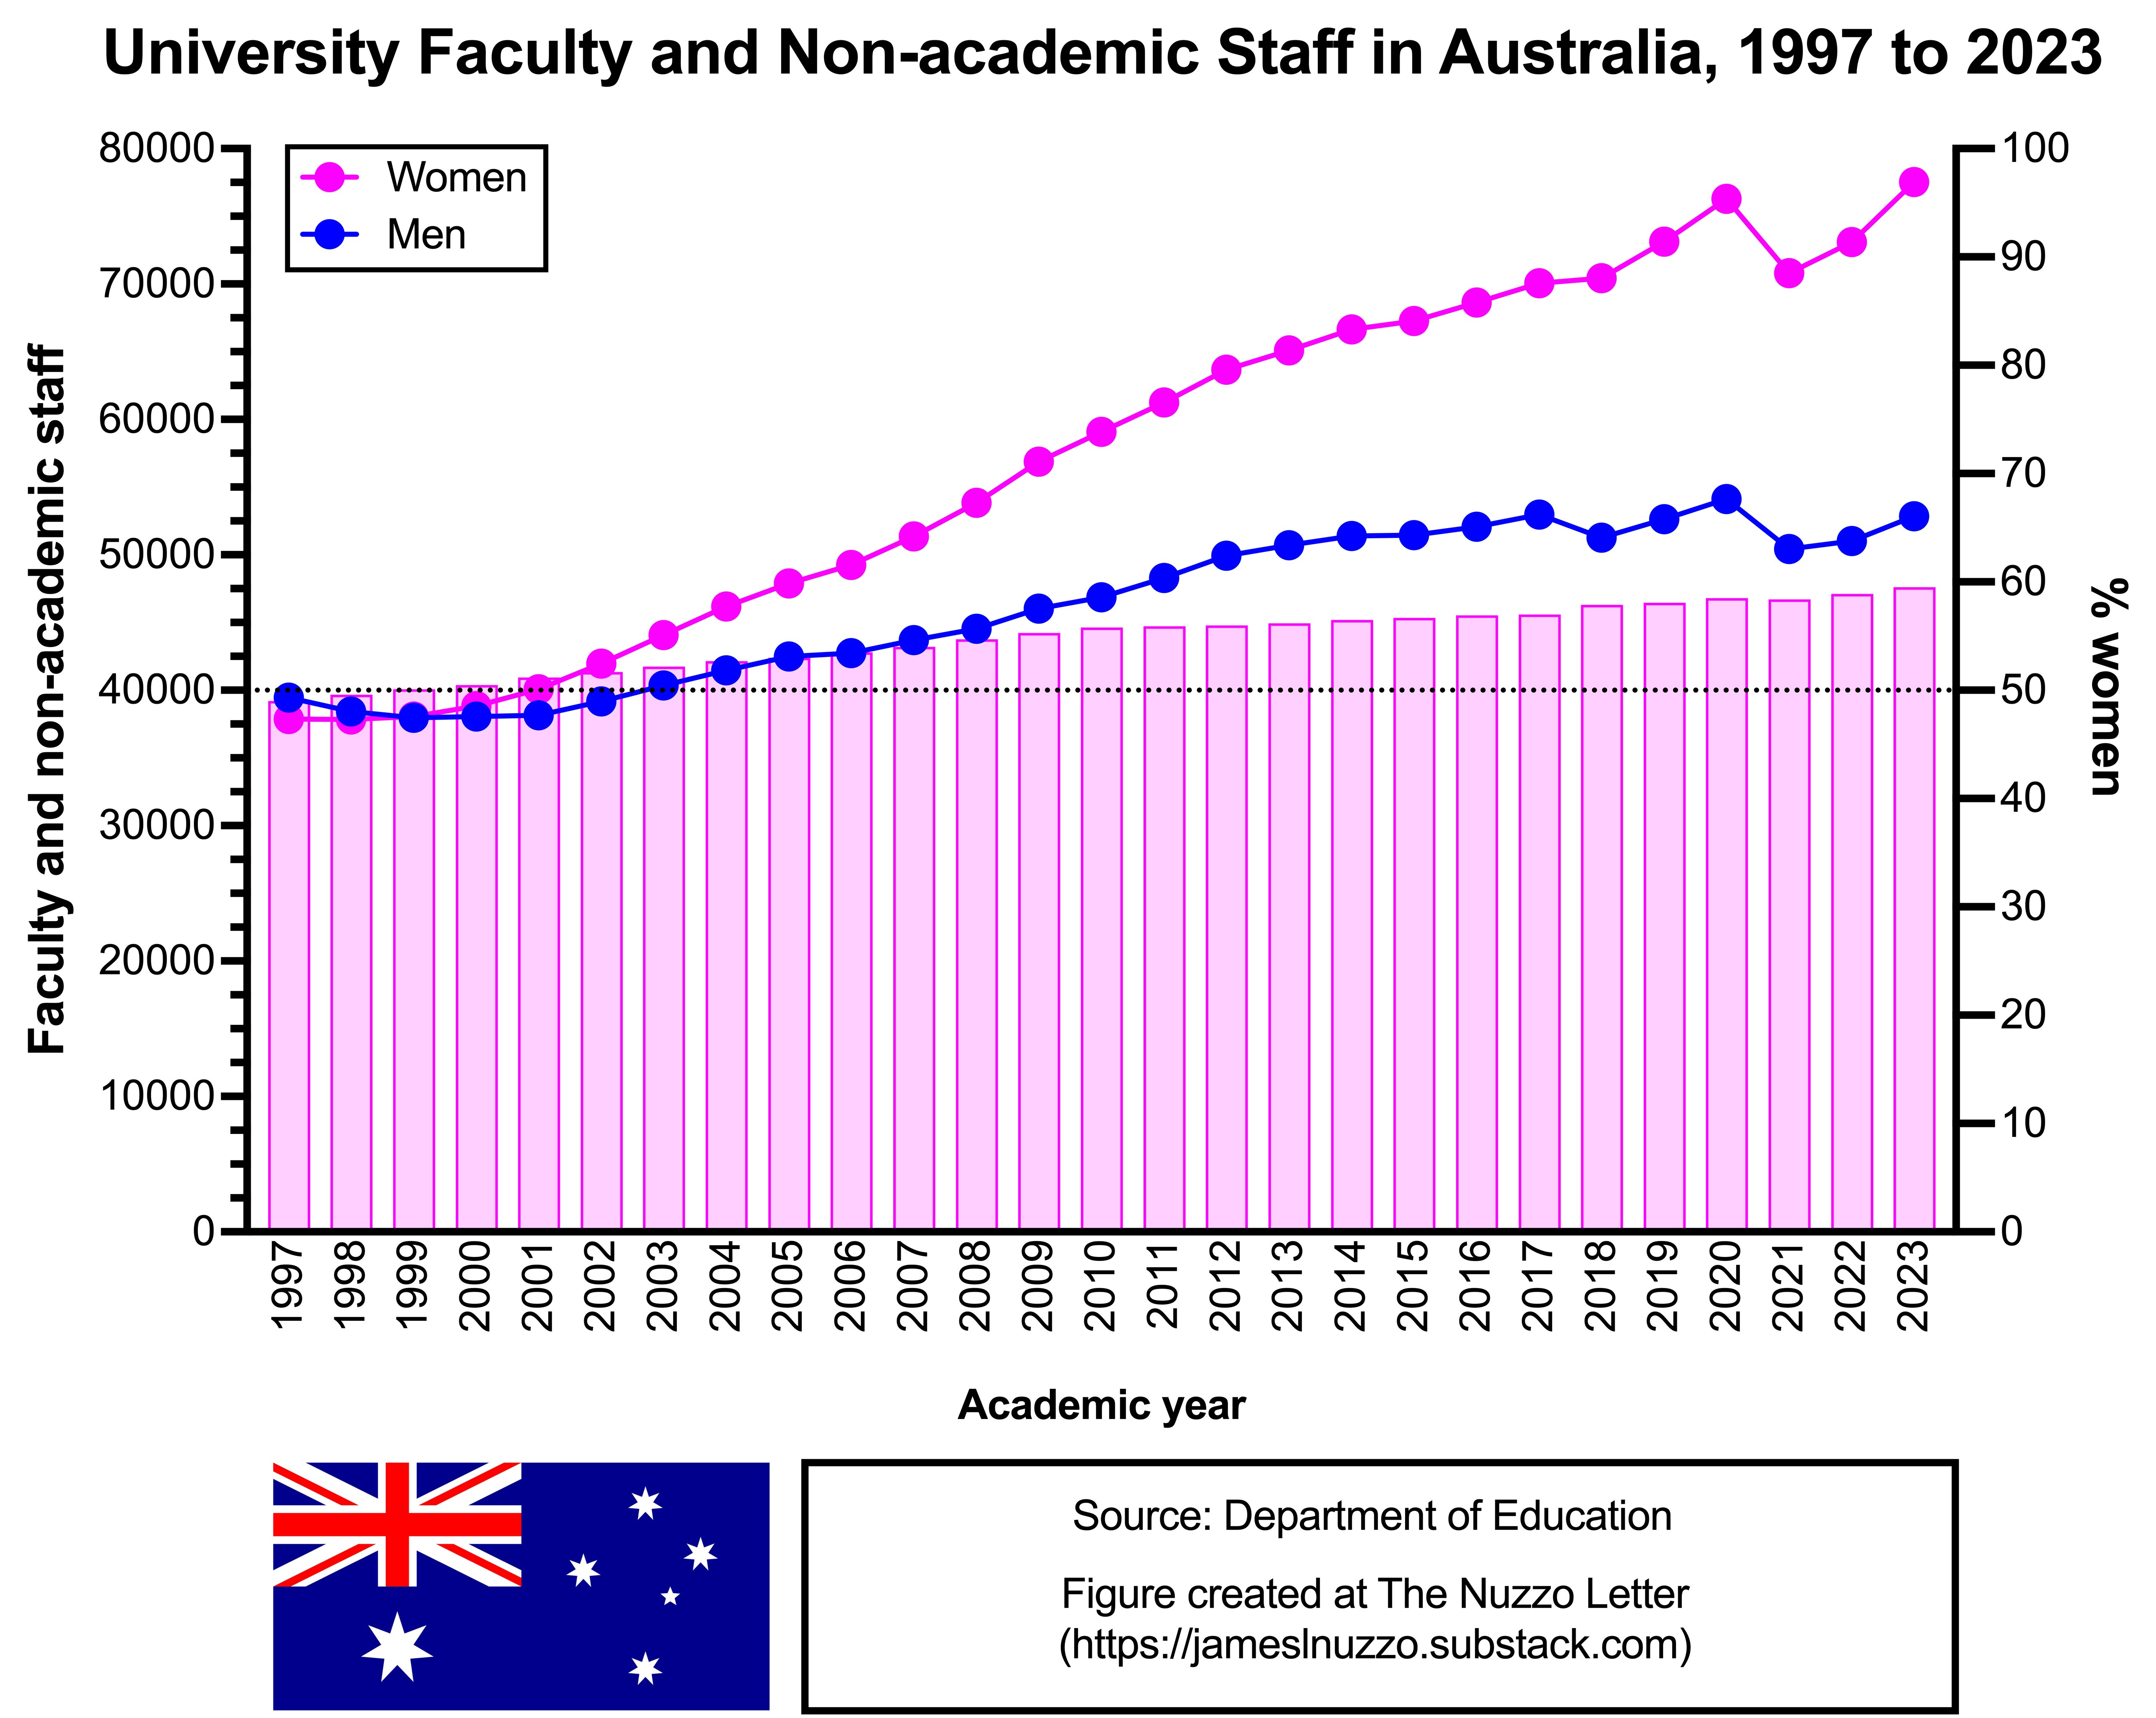
The third graph shows the annual number of male and female employees (faculty plus non-academic staff) at universities in Australia from 1997 to 2023. Because universities in Australia employee more non-academic staff than faculty, and women make up a significantly greater proportion of non-academic staff, women also make up a greater proportion of the total employees on campuses. The size of this sex difference has increased over time, because increases in numbers of non-academic staff have outpaced increases in numbers of faculty. In 1997, women made up 49.0% of total faculty and non-academic staff at universities in Australia. In 2023, women made up 59.5% of total faculty and non-academic staff at universities in Australia.
CANADA
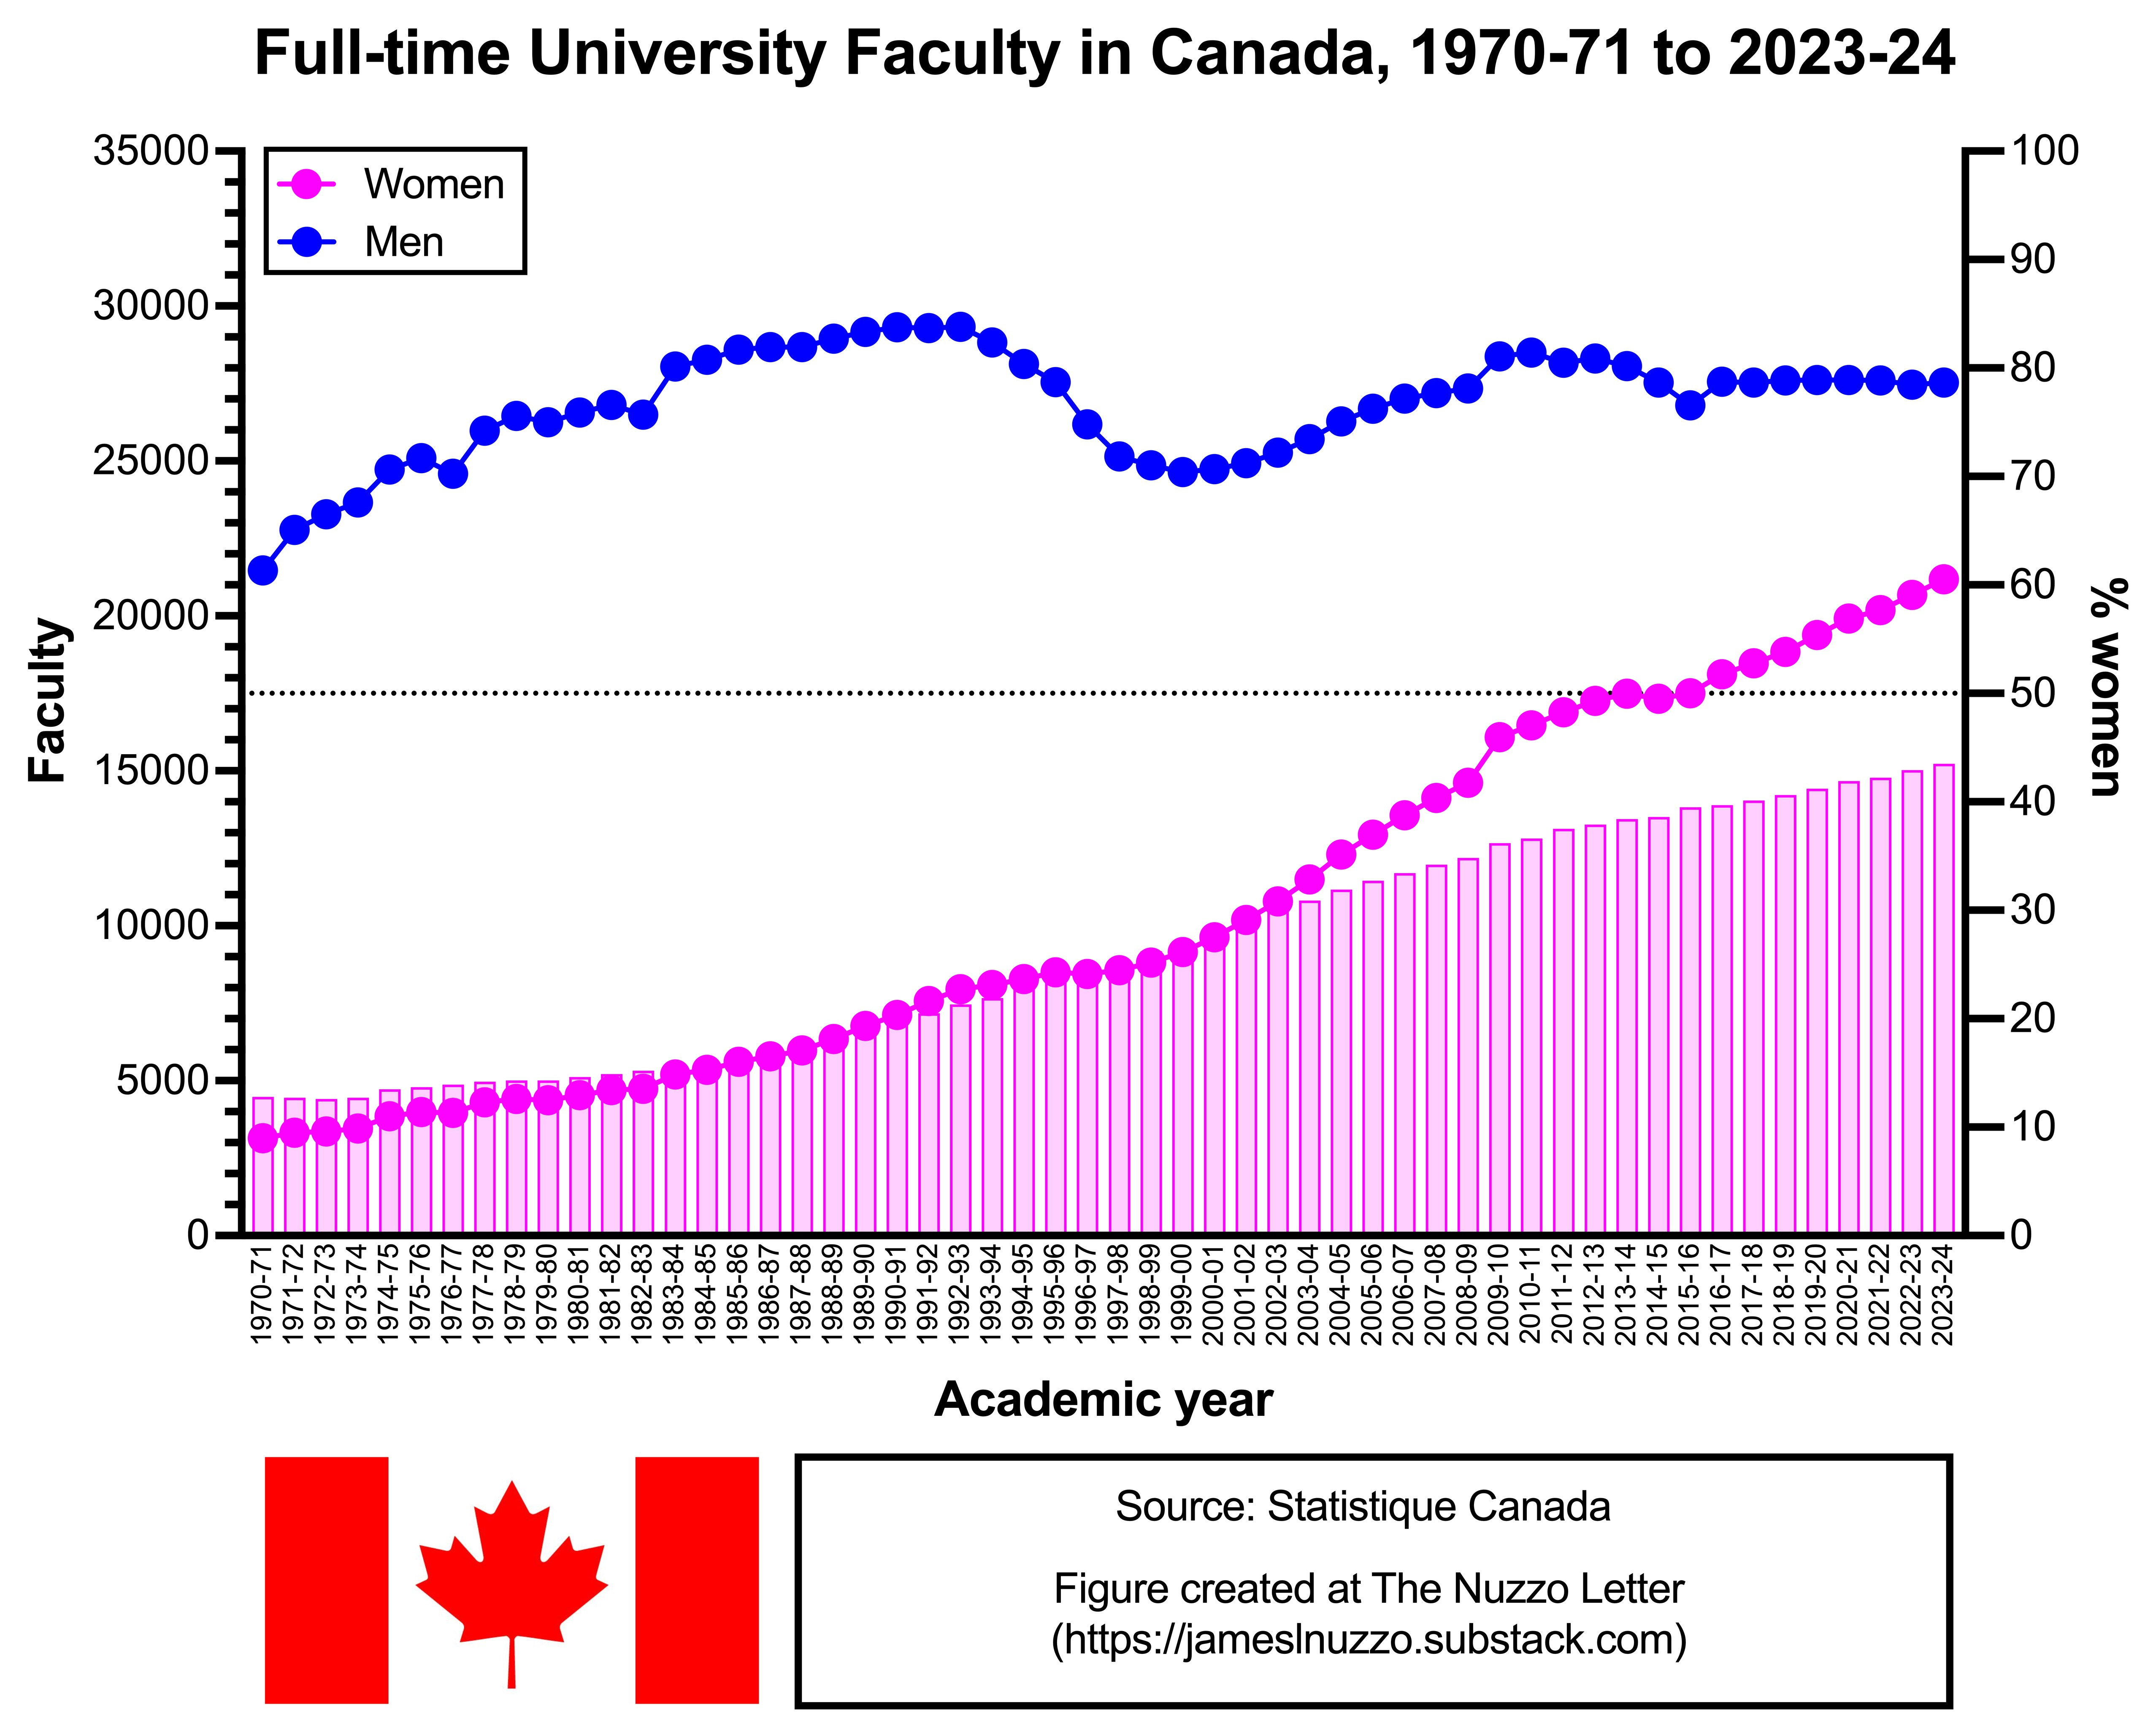
This graph shows the annual number of full-time1 male and female faculty members at universities in Canada from the 1970-71 to 2023-24 academic school years. Male full-time faculty have outnumbered female full-time faculty throughout Canada’s higher education history. The size of this sex difference has narrowed consistently over time, with 12.8% of full-time faculty as female in 1970-71 and 43.5% of full-time faculty as female in 2023.
UNITED STATES
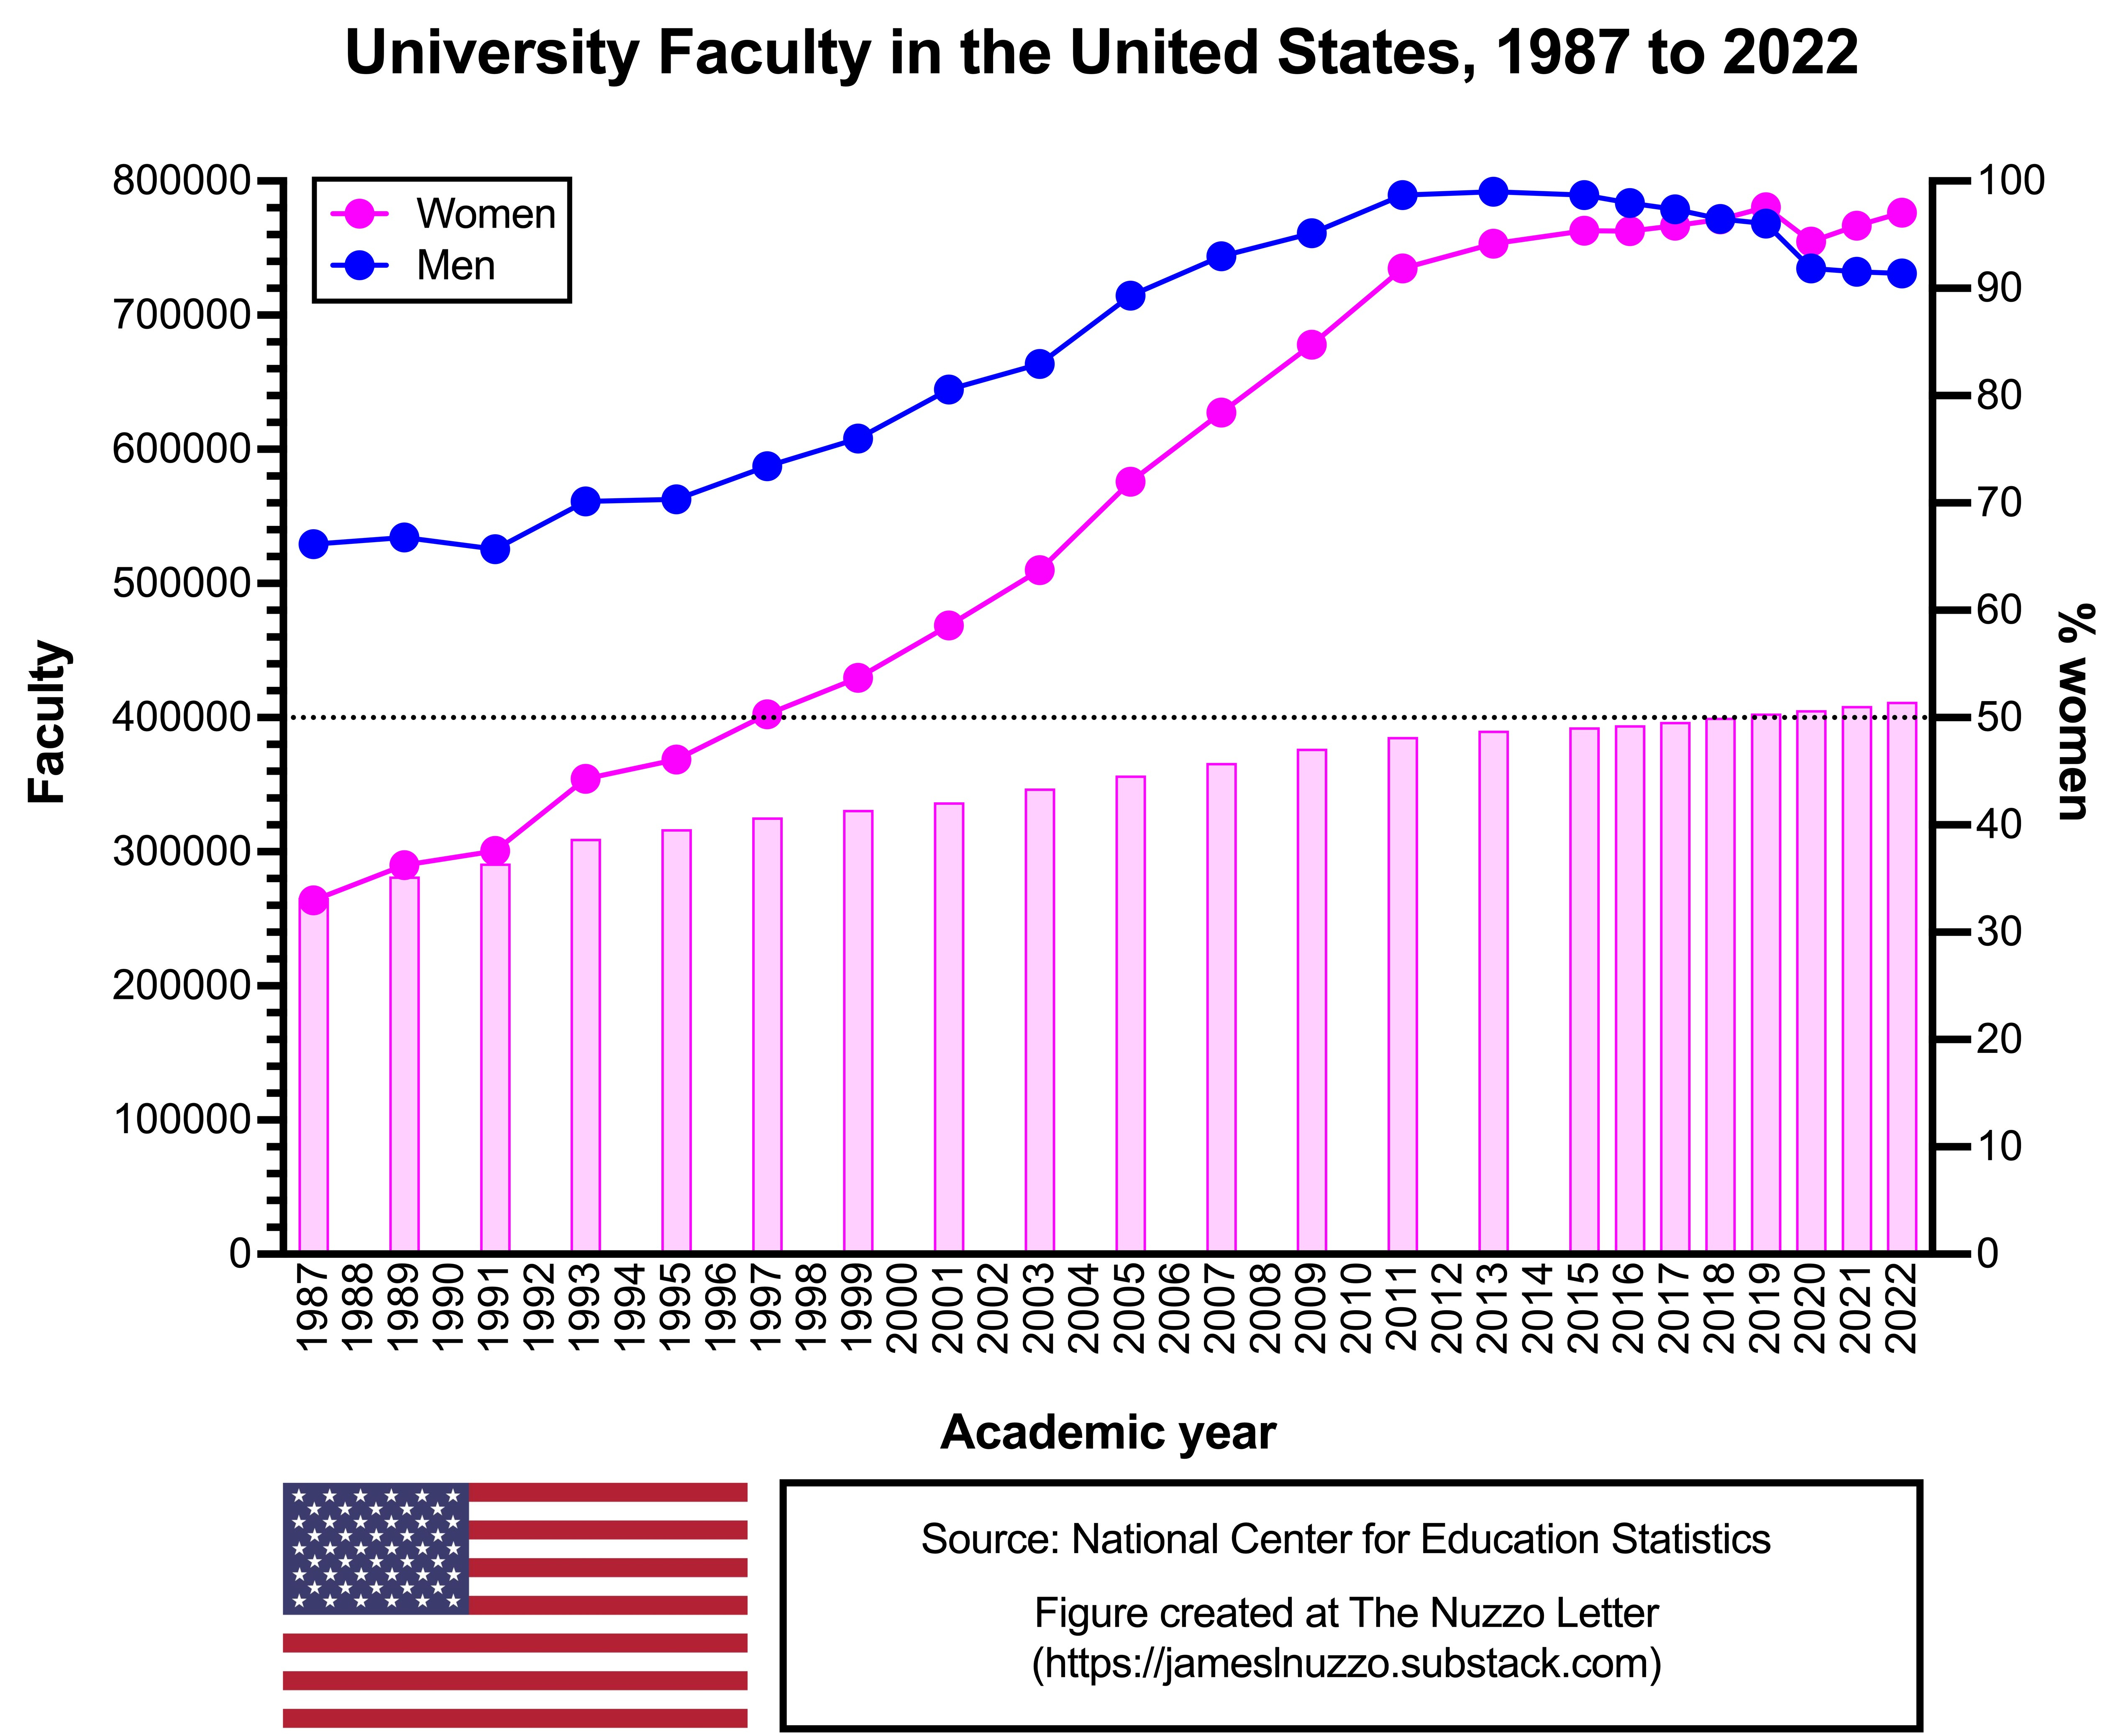
This graph shows the annual number of male and female faculty members at universities in the U.S. from 1987 to 2022. The number of male faculty peaked in 2013 and then started to decline from 2015 onward. The number of female faculty has increased over time, including the period since 2015 when male faculty numbers have declined. In 2018, 50% of faculty were female. Since 2018, the proportion of female faculty has continued to increase. In 2022, 51.5% of faculty at U.S. universities were women.
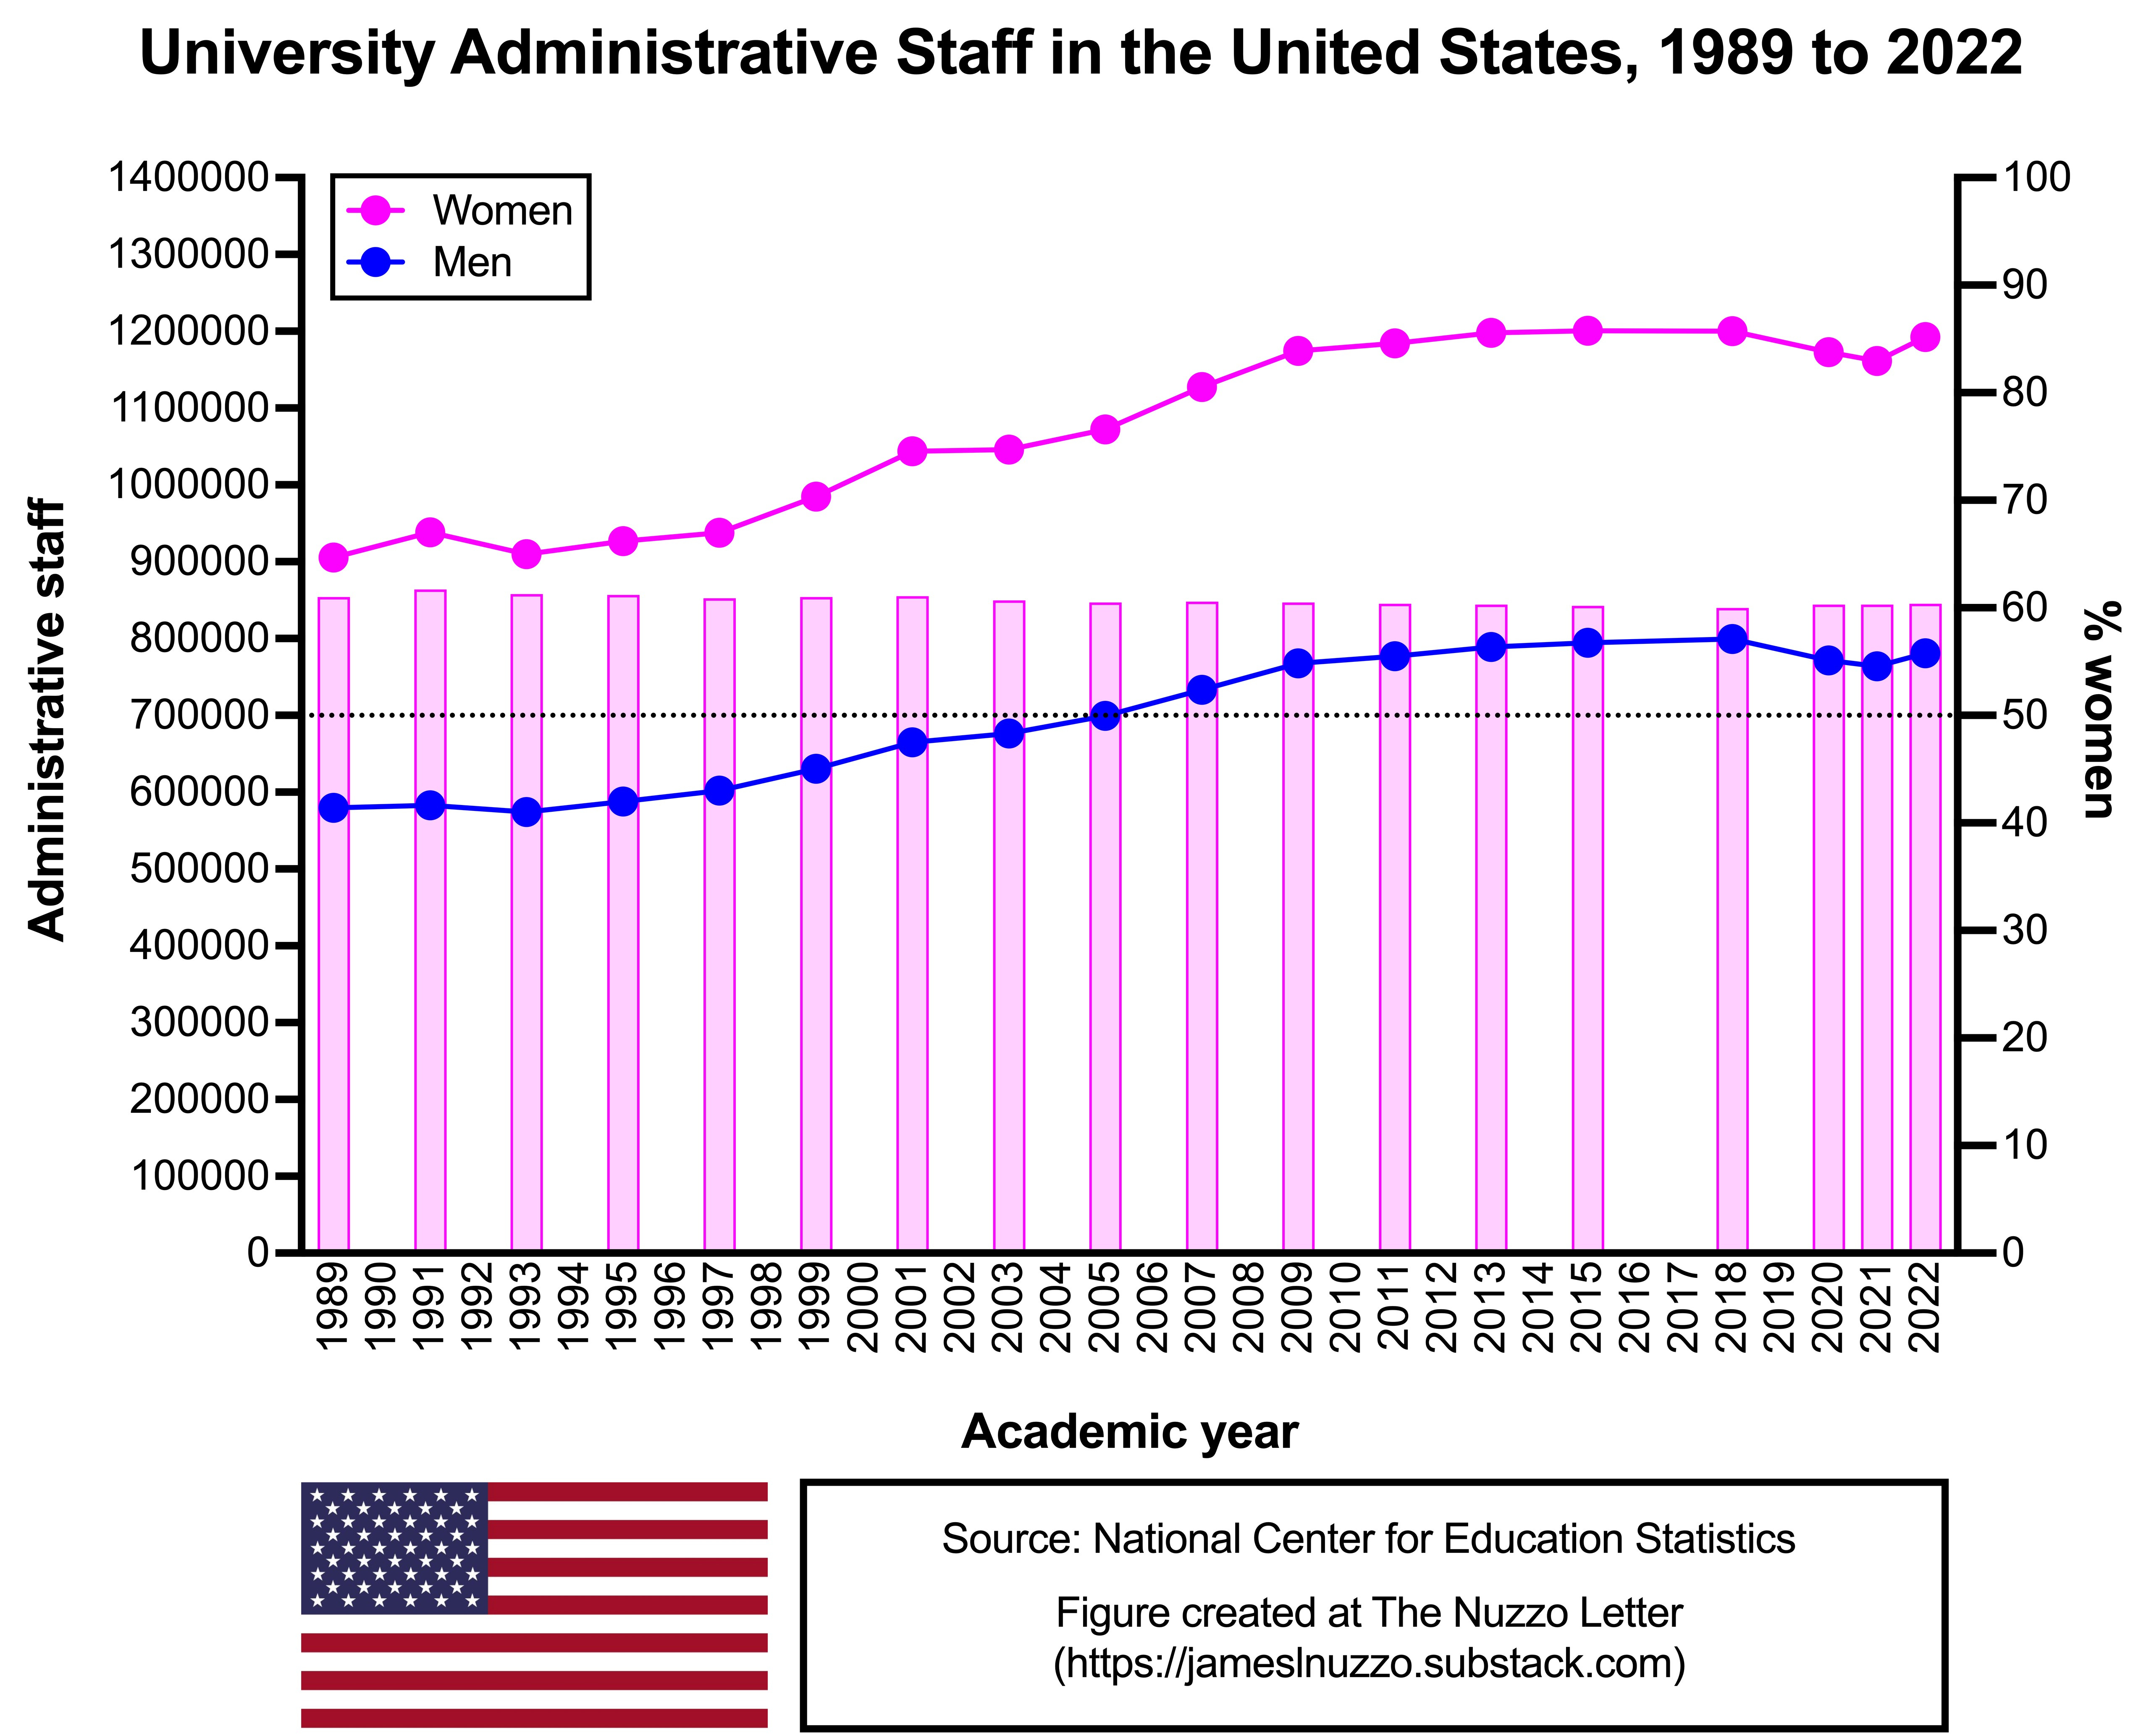
This graph shows the annual number of male and female administrative staff at universities in the U.S. from 1989 to 2022. The number of both male and female administrative staff has increased over time, with exception to the years associated with the COVID-19 pandemic. Women have consistently made up 60-61% of administrative staff at universities in the U.S. since 1989.
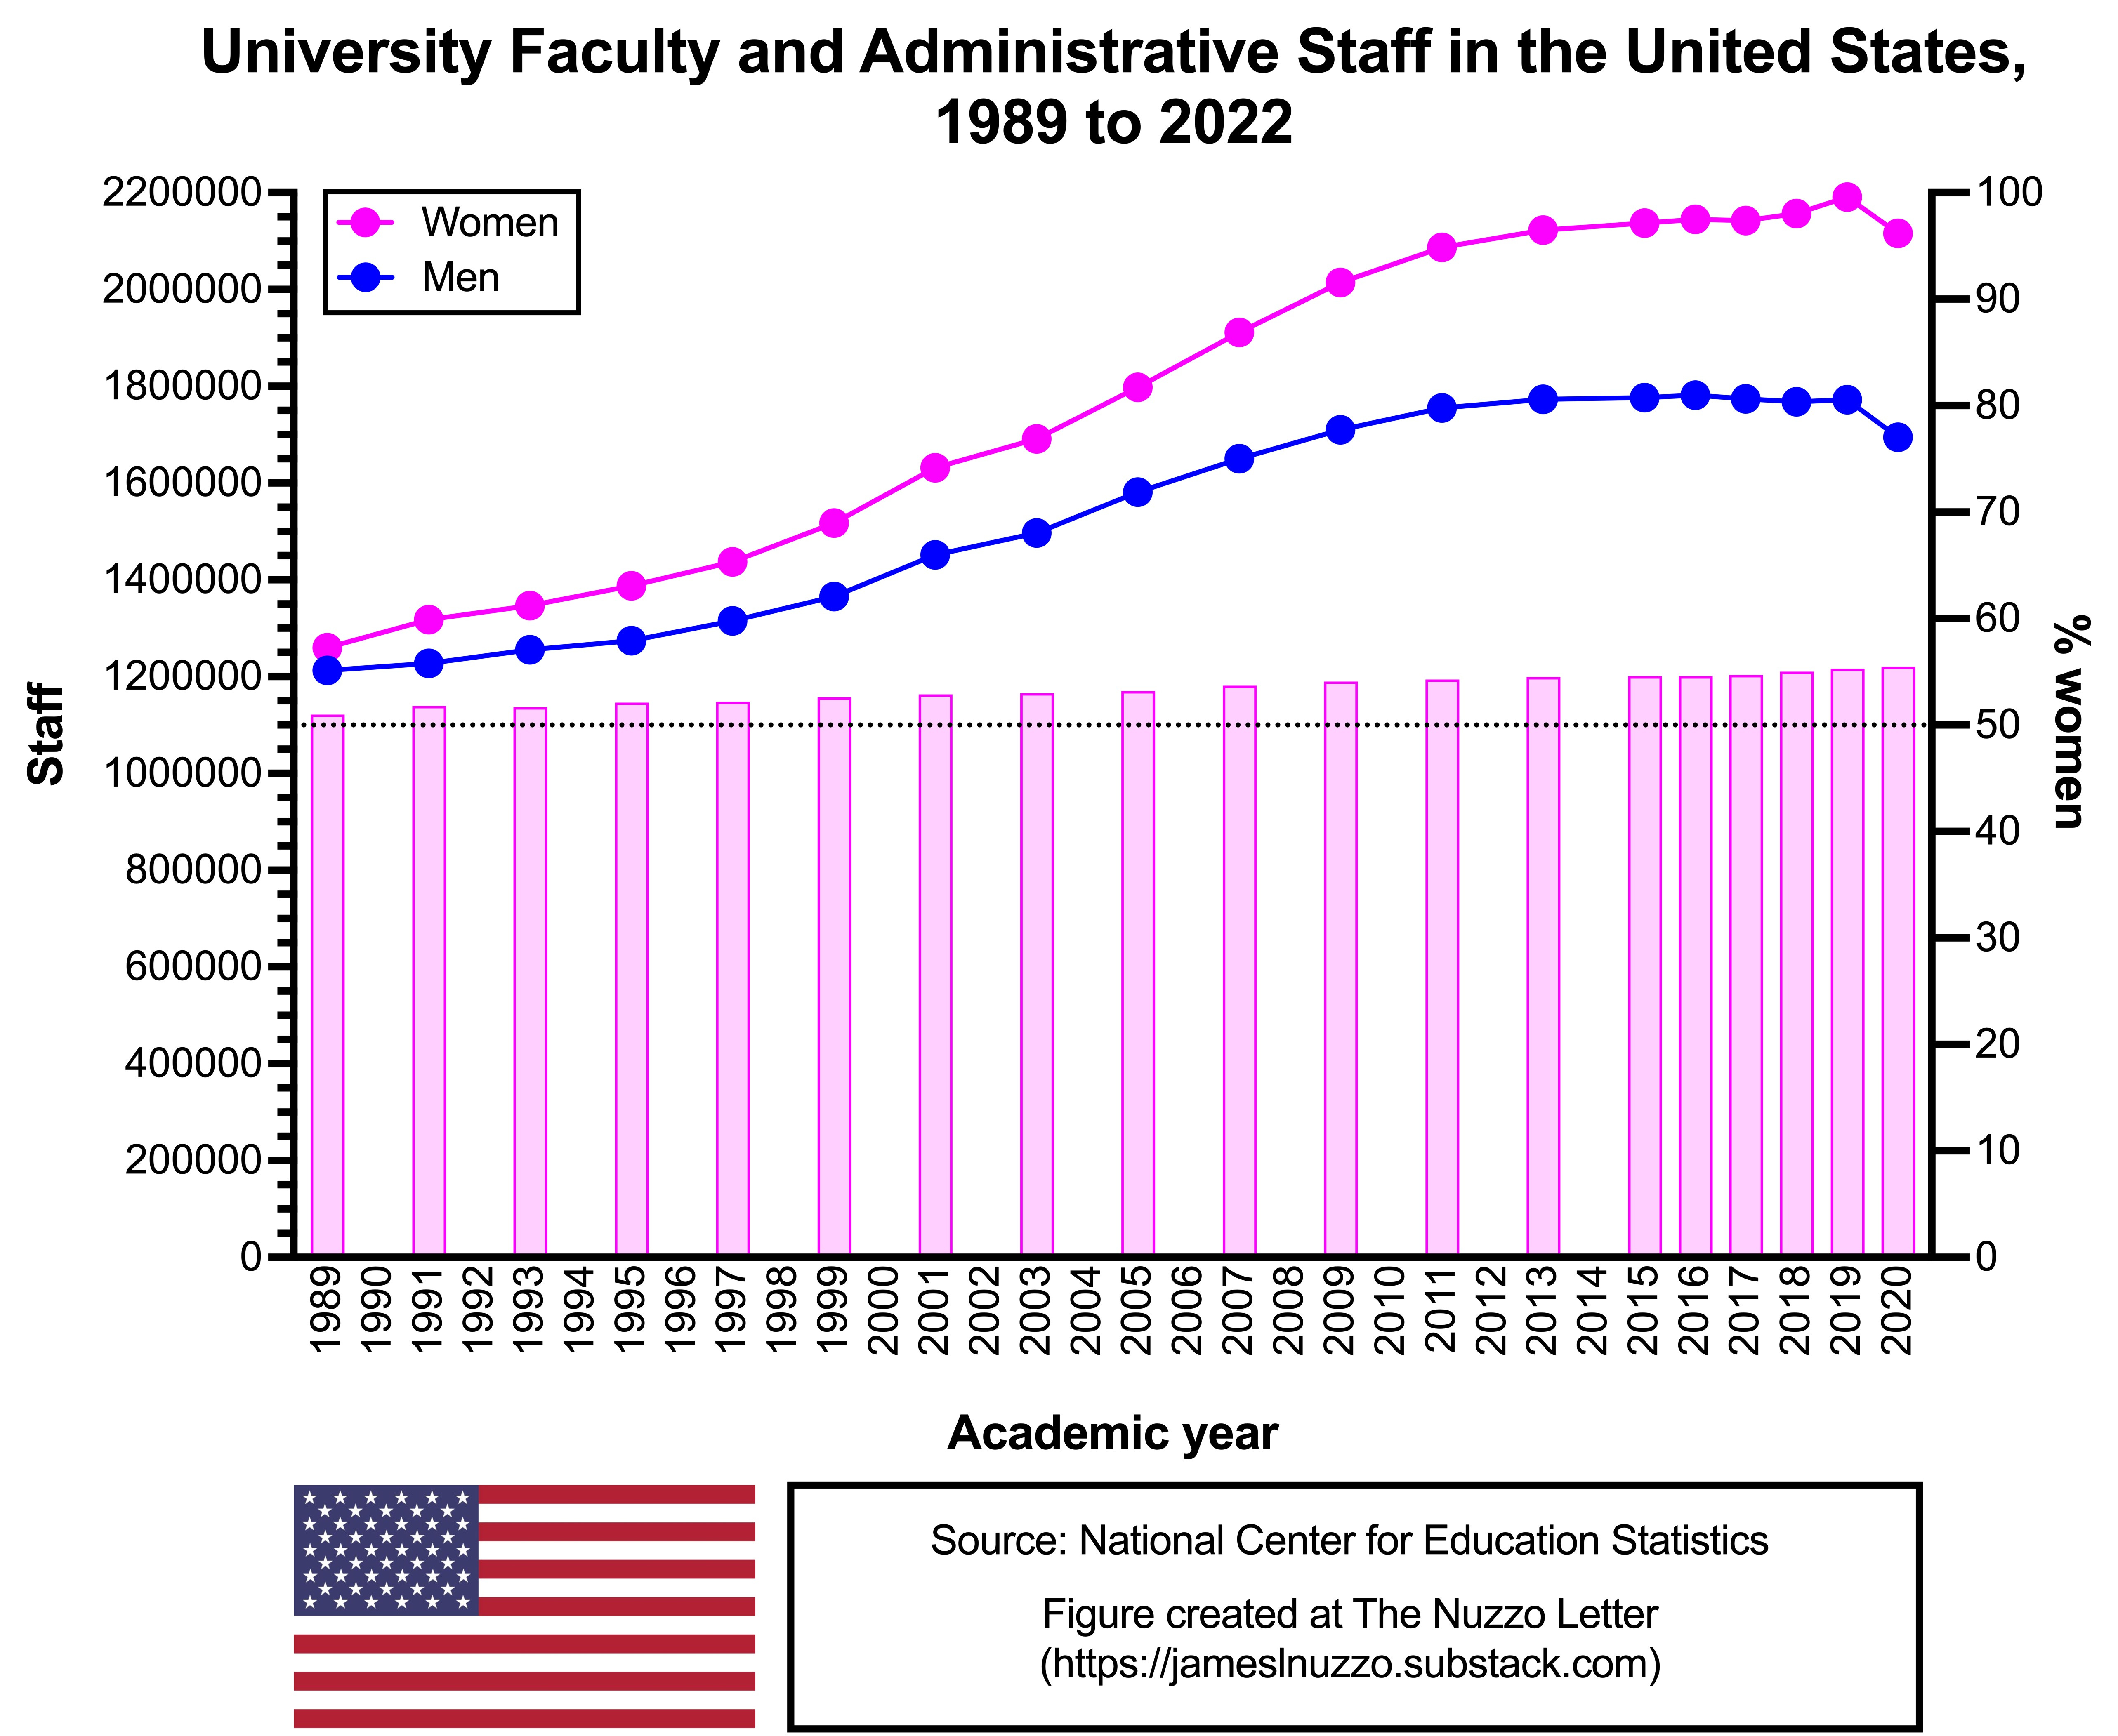
This graph shows the annual total number of male and female faculty and administrative staff at universities in the U.S. from 1989 to 2022. The total number of both male and female faculty and administrative staff increased until around 2015, after which these employee numbers started to plateau. In 1989, women made up 51.0% of all faculty and administrative staff at U.S. universities. In 2020, women made up 55.5% of all faculty and administrative staff at U.S. universities.
Bonus Commentary
Significantly more women than men work in non-academic administrative roles in universities. This sex difference has existed for many years and currently stands at 60-67% female representation. Historically, women have made up fewer faculty members than men. This is still true for full-time faculty members in Canada, but it is no longer true in Australia or the U.S. Thus, universities now employee significantly more female than male staff.
On average, men and women have different interests and concerns. Thus, the changing sex demography of universities likely underpins much of the culture shift observed at universities over the past the past several years, including things like grade inflation, safe spaces, and heightened focus on diversity, equity, and inclusion. For further reading on this topic, please see “Sex and the Academy” published in Quillette in 2022.
Related Content at The Nuzzo Letter


SUPPORT THE NUZZO LETTER
If you appreciated this content, please consider supporting The Nuzzo Letter with a one-time or recurring donation. Your support is greatly appreciated. It helps me to continue to work on independent research projects and fight for my evidence-based discourse. To donate, click the DonorBox logo. In two simple steps, you can donate using ApplePay, PayPal, or another service. Thank you!

I could not find data of part-time faculty at Canadian universities. Data on part-time faculty would likely narrow the size of the sex difference.
So.. we know that women have come out of the home. Where have the men who would otherwise been working in these positions, or federal gov positions etc gone? Private enterprise? I don’t think the private sector has grown the same. Where did we go?