
Myalgic Encephalomyelitis/Chronic Fatigue Syndrome in the United States
Graph of the Week

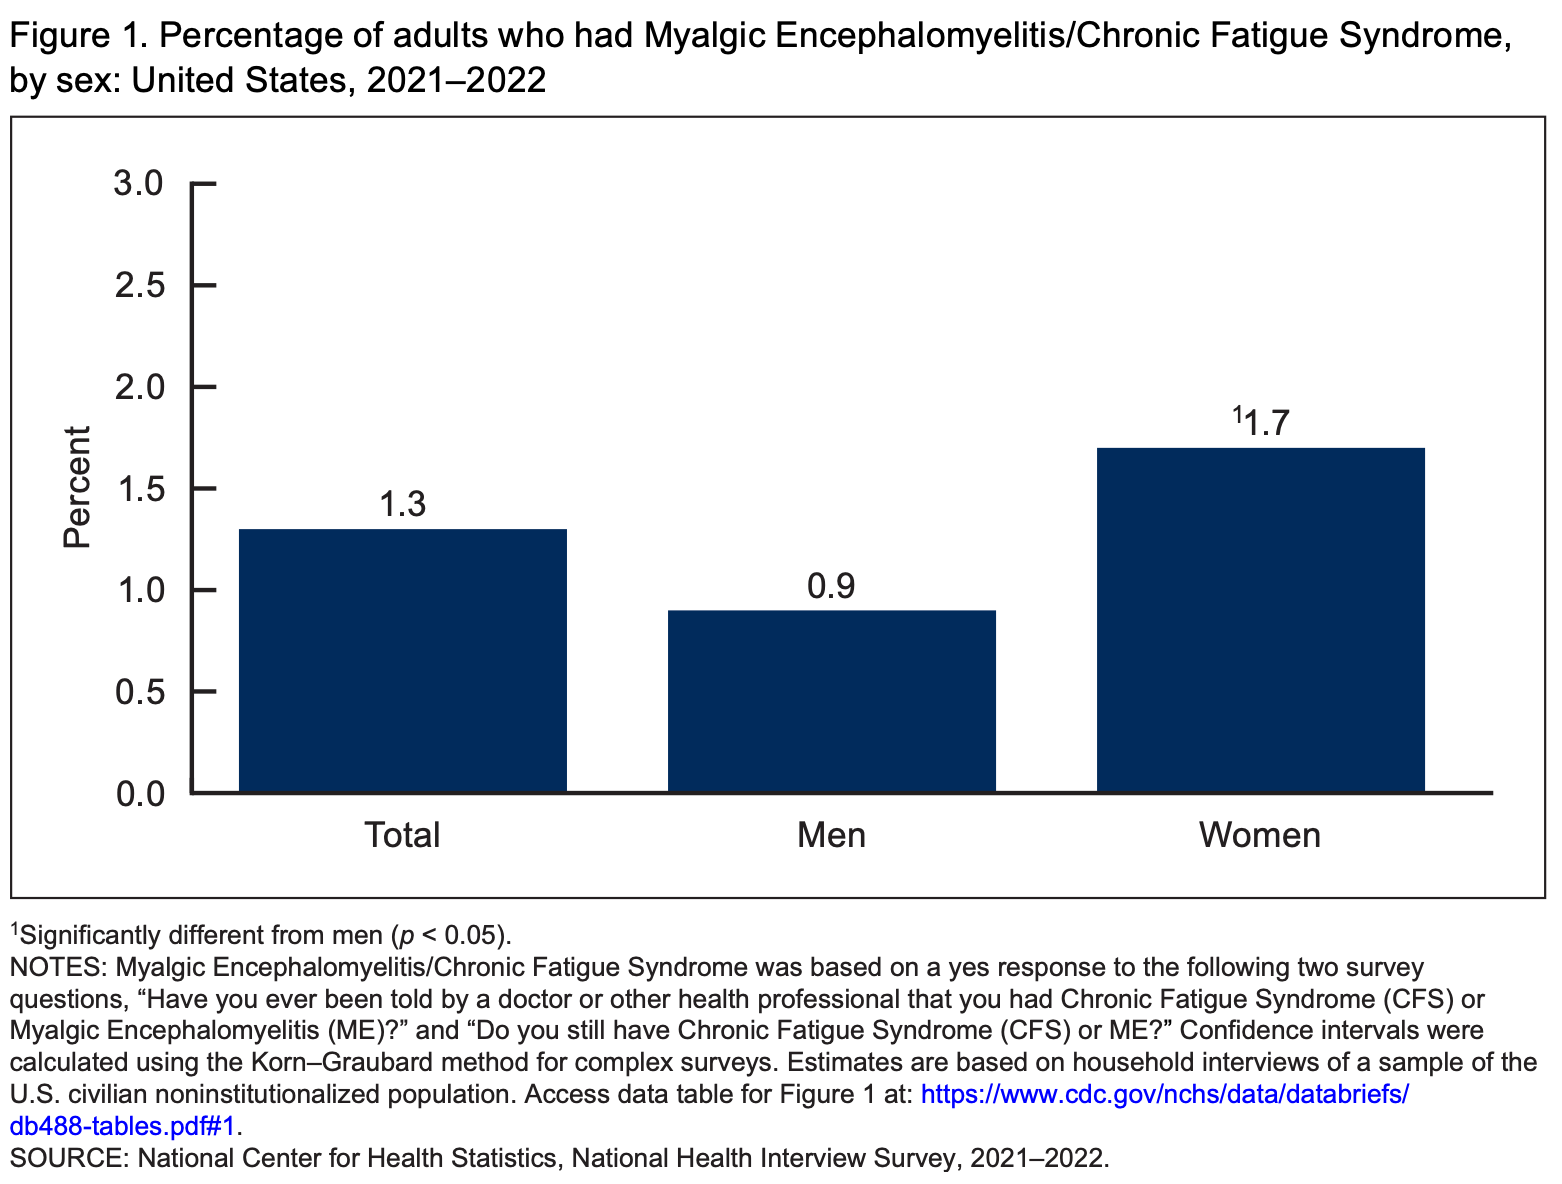
This week’s graphs, courtesy of a report by the National Center for Health Statistics, illustrate the prevalence of Myalgic Encephalomyelitis/Chronic Fatigue Syndrome (ME/CFS) in the United States (U.S.) in 2021-2022.
Key Points
In 2021-2022, 1.3% of individuals in the U.S. reported that they were told by a doctor or other health professional that they had ME/CFS (Figure 1). The prevalence of ME/CFS differed by sex, with women having a higher prevalence (1.3%) than men (0.9%).
Prevalence of ME/CFS also differed by age (Figure 2). Rates were higher in individuals aged 50-69 years than individuals in other age groups.
Prevalence of ME/CFS also differed by race (Figure 3). White individuals had a higher prevalence of ME/CFS than Asian and Hispanic individuals.


Source: Vahratian A, Lin JS, Bertolli J, Unger ER. Myalgic encephalomyelitis/chronic fatigue syndrome in adults: United States, 2021–2022. NCHS Data Brief, no 488. Hyattsville, MD: National Center for Health Statistics. 2023.
Bonus Commentary
Myalgic Encephalomyelitis/Chronic Fatigue Syndrome (ME/CFS) is a debilitating condition that can severely impact quality of life. Common symptoms of ME/CFS include fatigue, pain, post-exertional malaise, cognitive issues, memory impairment, and poor sleep. Often, ME/CFS is caused by a viral infection. Interestingly, ME/CFS and long COVID have much overlap in symptoms, and the occurrence of long COVID around the world has brought increased attention to ME/CFS.
Related Content at The Nuzzo Letter


SUPPORT THE NUZZO LETTER
If you appreciated this content, please consider supporting The Nuzzo Letter with a one-time or recurring donation. Your support is greatly appreciated. It helps me to continue to work on independent research projects and fight for my evidence-based discourse. To donate, click the DonorBox logo. In two simple steps, you can donate using ApplePay, PayPal, or another service. Thank you.
