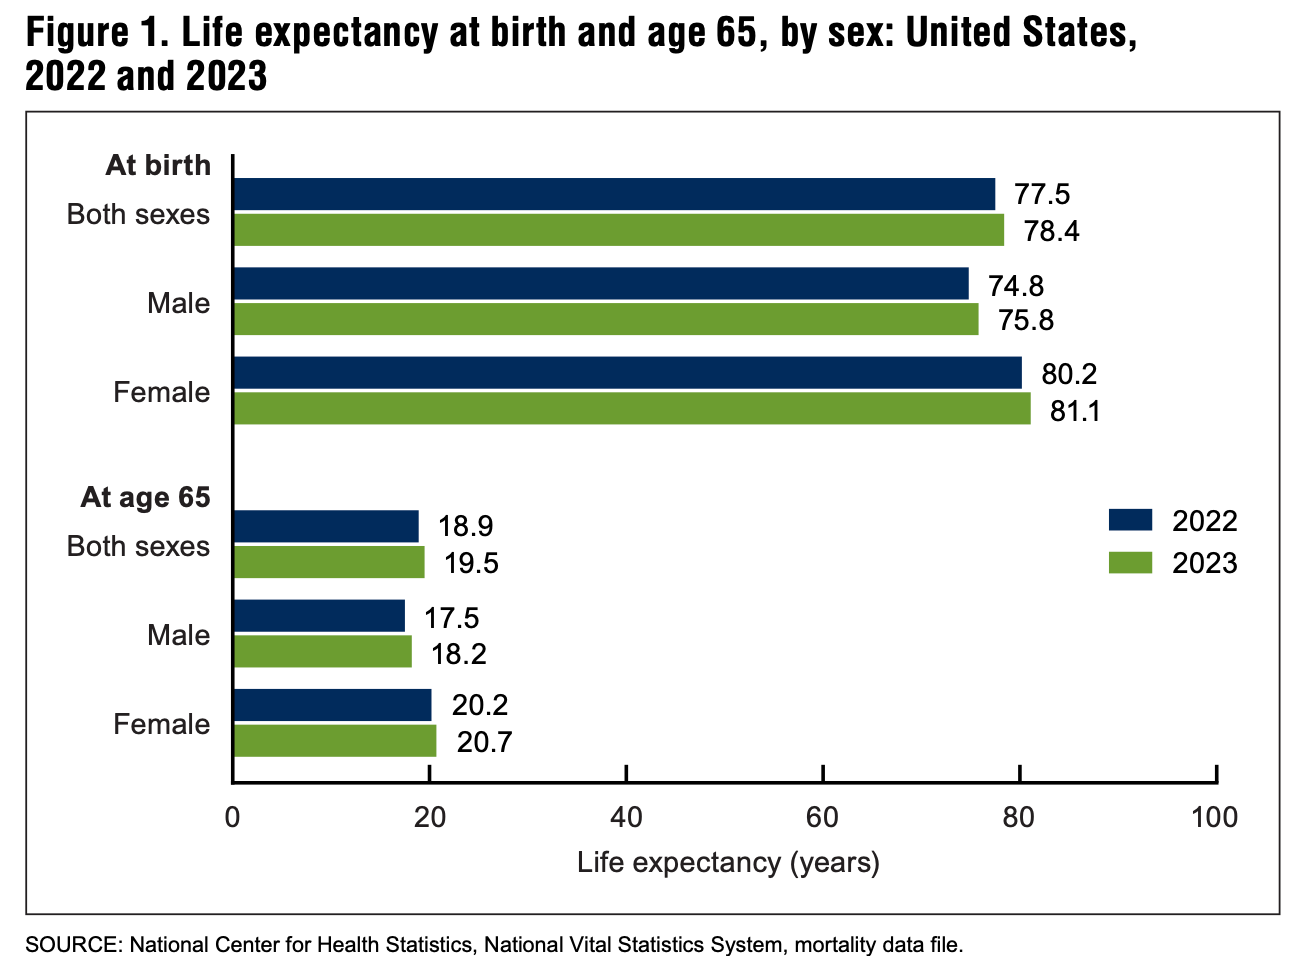
This week’s graph, courtesy of a report published by the United States (U.S.) National Center for Health Statistics in December of 2024, illustrates male and female life expectancy in the U.S. in 2022 and 2023 (last year data are available).
Key Points
• In the U.S., life expectancy at birth is significantly shorter for males than females.
• In 2023, male and female life expectancy were 75.8 and 81.1 years, respectively (Figure 1). Thus, the current sex difference in life expectancy in the U.S. is 5.3 years.
• Both male and female life expectancy increased by about one year from 2022 to 2023. This increase was largely driven by fewer deaths caused by COVID-19 in 2023 (Figure 4).
Source: Murphy SL, Kochanek KD, Xu JQ, Arias E. Mortality in the United States, 2023. NCHS Data Brief, no 521. Hyattsville, MD: National Center for Health Statistics. 2024.
Bonus Commentary
Male life expectancy is significantly shorter than female life expectancy. This result has existed in the U.S. for many years. However, the size of this difference has changed throughout history. This suggests that sex differences in life expectancy are not solely biologically determined. Life expectancy is impacted by biology, environment, and one’s choices and behaviors. Remarkably, though male life expectancy continues to be significantly shorter than female life expectancy in the U.S., significantly more government resources go toward improving women’s than men’s health. For example, U.S. government has several offices dedicated to women’s health and none dedicated to men’s health. Moreover, the National Institutes of Health (NIH) invest significantly more money into women’s health than men’s health research each year.
Related Content at The Nuzzo Letter
SUPPORT THE NUZZO LETTER
If you appreciated this content, please consider supporting The Nuzzo Letter with a one-time or recurring donation. Your support is greatly appreciated. It helps me to continue to work on independent research projects and fight for my evidence-based discourse. To donate, click the DonorBox logo. In two simple steps, you can donate using ApplePay, PayPal, or another service. Thank you!


Very interesting information as usual.
Can you explain what age adjusted death rate (title of figure 4) means?
I seem to fail to understand what it is and how it relates to the table below.
Thanks.