This week’s graphs, courtesy of a report by the Center for American Women and Politics, illustrates the proportional representation of male and female members of the United States (U.S.) Congress from 1917 to the 2023-2025 term.
The U.S. Congress is made up of the Senate and House of Representatives. The Senate consists of 100 members (two from each of the 50 U.S. states). The House of Representative consists of 435 members (based on population size of each of the 50 U.S. states). Every two years, including this year, one-third of the Senate is up for election, while all 435 seats in the House are up for election.
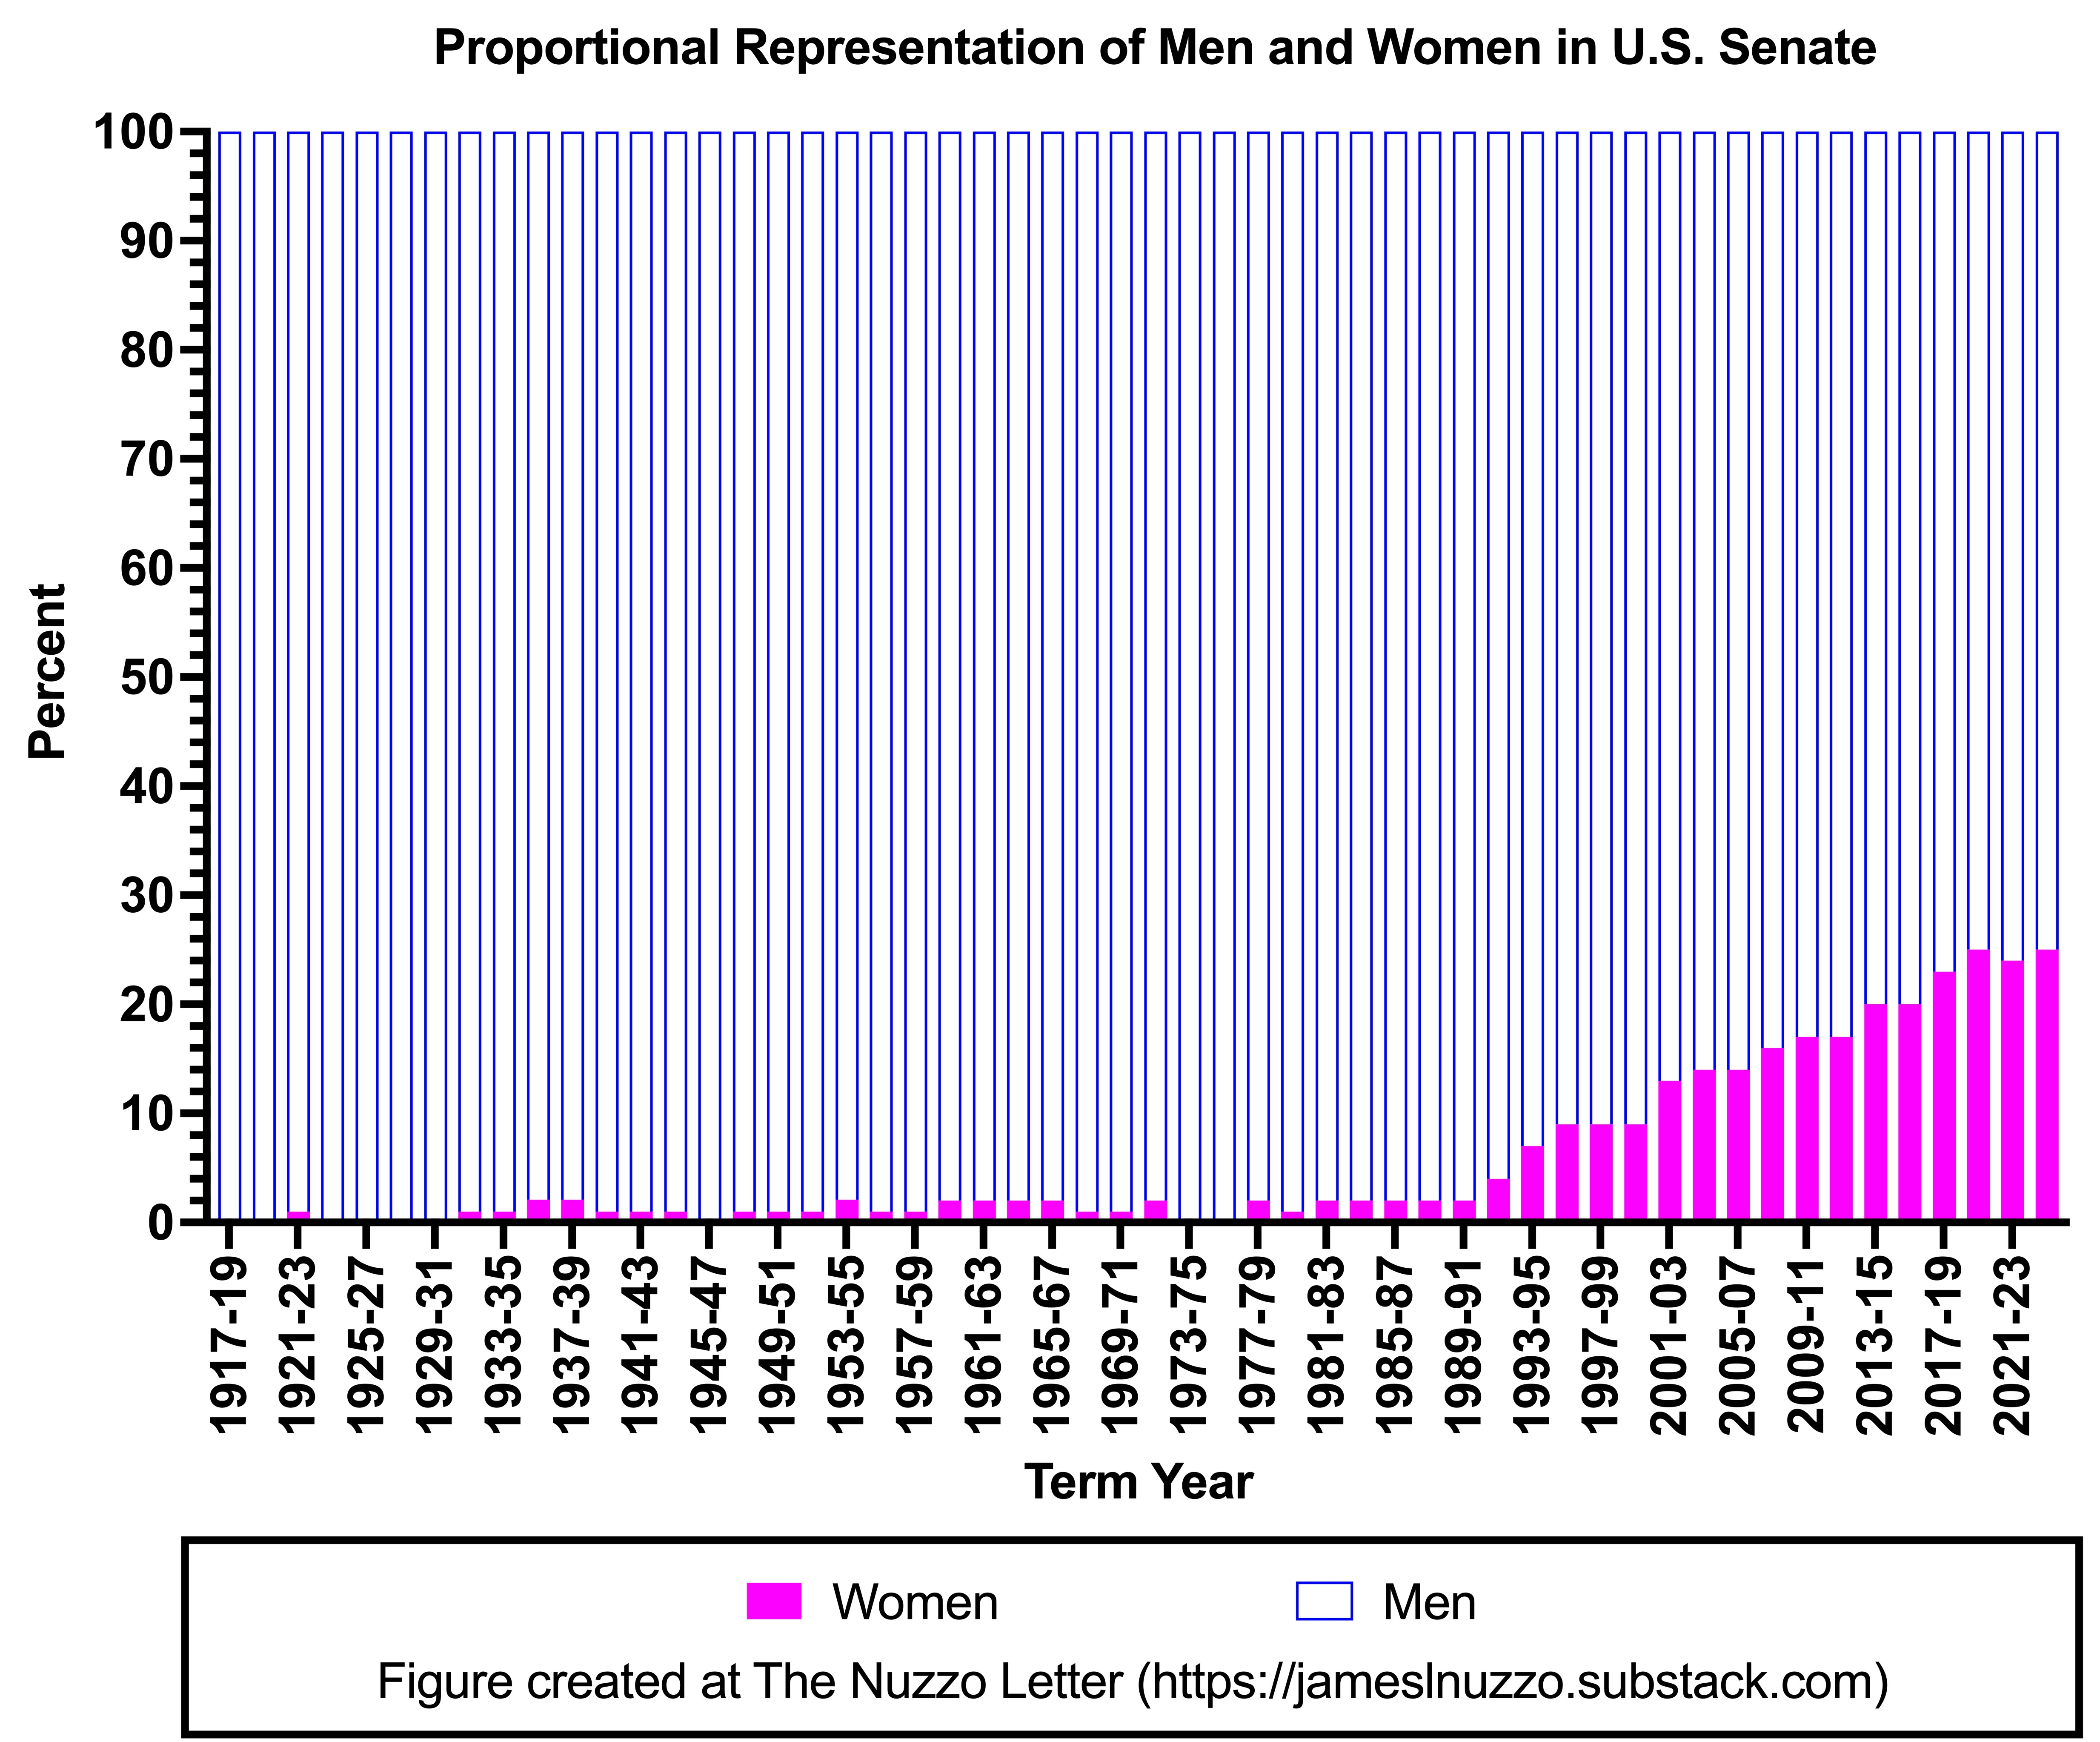
U.S. Senate
The number of women serving in the U.S. Senate has increased over time, particularly since the early 1990s.
For the 2023-2025 term, 25 women served in the Senate (25%).
Women serving in the U.S. Senate in 2023-2025 were more likely to be Democrat than Republican. They include 15 Democrats, 9 Republicans, and 1 Independent.
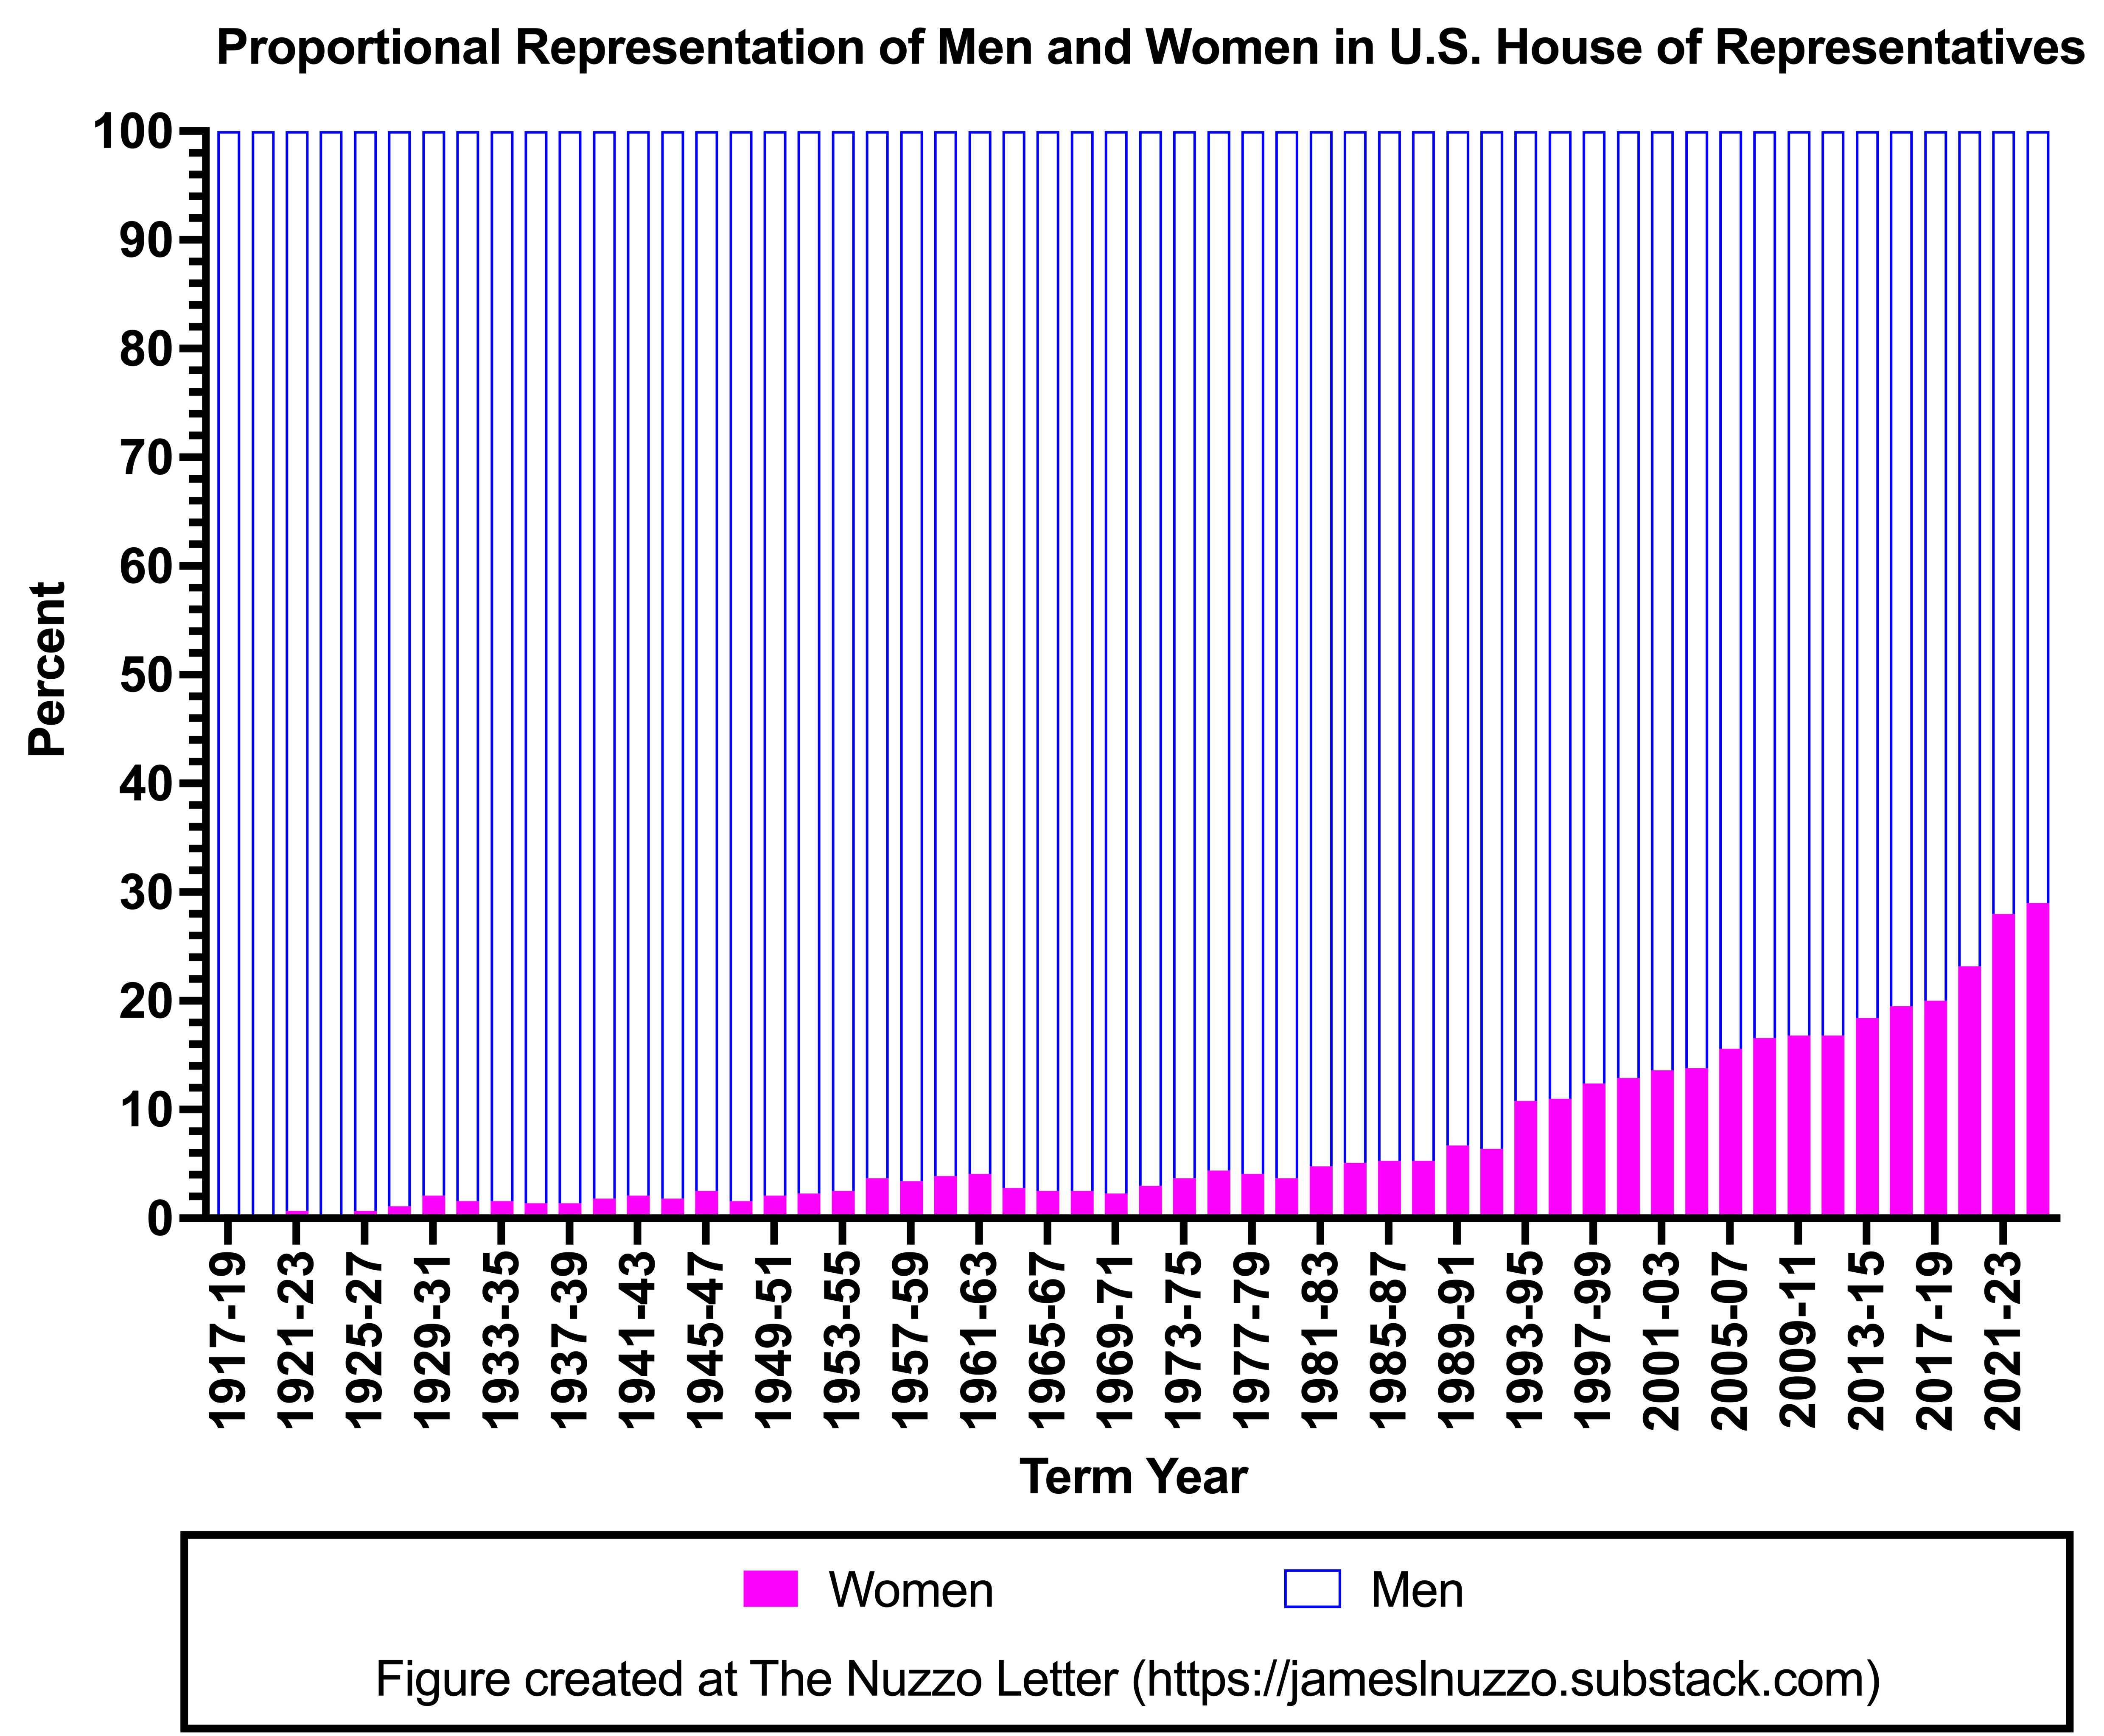
U.S. House of Representatives
The number of women serving in the U.S. House of Representatives has increased over time, particularly since the early 1990s.
For the 2023-2025 term, 126 women served in the House of Representatives (29%).
Women serving in the U.S. House of Representatives in 2023-2025 were more likely to be Democrat than Republican. They included 96 Democrats and 34 Republicans.
Source: Center for American Women and Politics. History of Women in the U.S. Congress. 2024.
Bonus Commentary
Numbers of women senators and representatives have increased over time. Women now make up about one-quarter of the U.S. Congress. As the proportional representation of men and women in Congress changes, one should expect changes in legislative philosophy. The reason is because, on average, men and women do not have the same political beliefs, and this conclusion is reinforced by the observation that of the women in Congress, significantly more are Democrats than Republicans. Quoting from another similar post at The Nuzzo Letter on sex differences in voting behaviors:
“Average sex differences in voting behaviors stem from average sex differences in beliefs about what the role of government ought to be. Women are more likely than men to profess egalitarian and collectivist beliefs that favour redistribution policies and greater government involvement in many aspects of everyday life. For example, women are more likely than men to believe in increased spending on healthcare, Social Security, and assistance to poor people. Women are also more likely than men to express desire for more environmental protections and for increased spending on the environment. Women are also more likely than men to express support for “inclusion” and “equity” policies such as racial preferences in hiring and promotion, inclusion of transgender individuals in women’s spaces, and allowing illegal immigrants to remain in the country. Results from one study suggest that women’s preferences for collectivist policies likely stem from women’s greater risk aversiveness, lower competitiveness, preference for “equality” over efficiency, and lower confidence in their own abilities.”
Thus, as women, whether as voters or legislators, have different views on what the role of government ought to be in people’s lives, changes in the proportional representations of men and women in the U.S. Congress over time will almost certainly change the size and focus of government.
Related Content at The Nuzzo Letter


SUPPORT THE NUZZO LETTER
If you appreciated this content, please consider supporting The Nuzzo Letter with a one-time or recurring donation. Your support is greatly appreciated. It helps me to continue to work on independent research projects and fight for my evidence-based discourse. To donate, click the DonorBox logo. In two simple steps, you can donate using ApplePay, PayPal, or another service. Thank you!