
Unintentional Drowning Deaths in the United States, 2019-2022
Graph of the Week

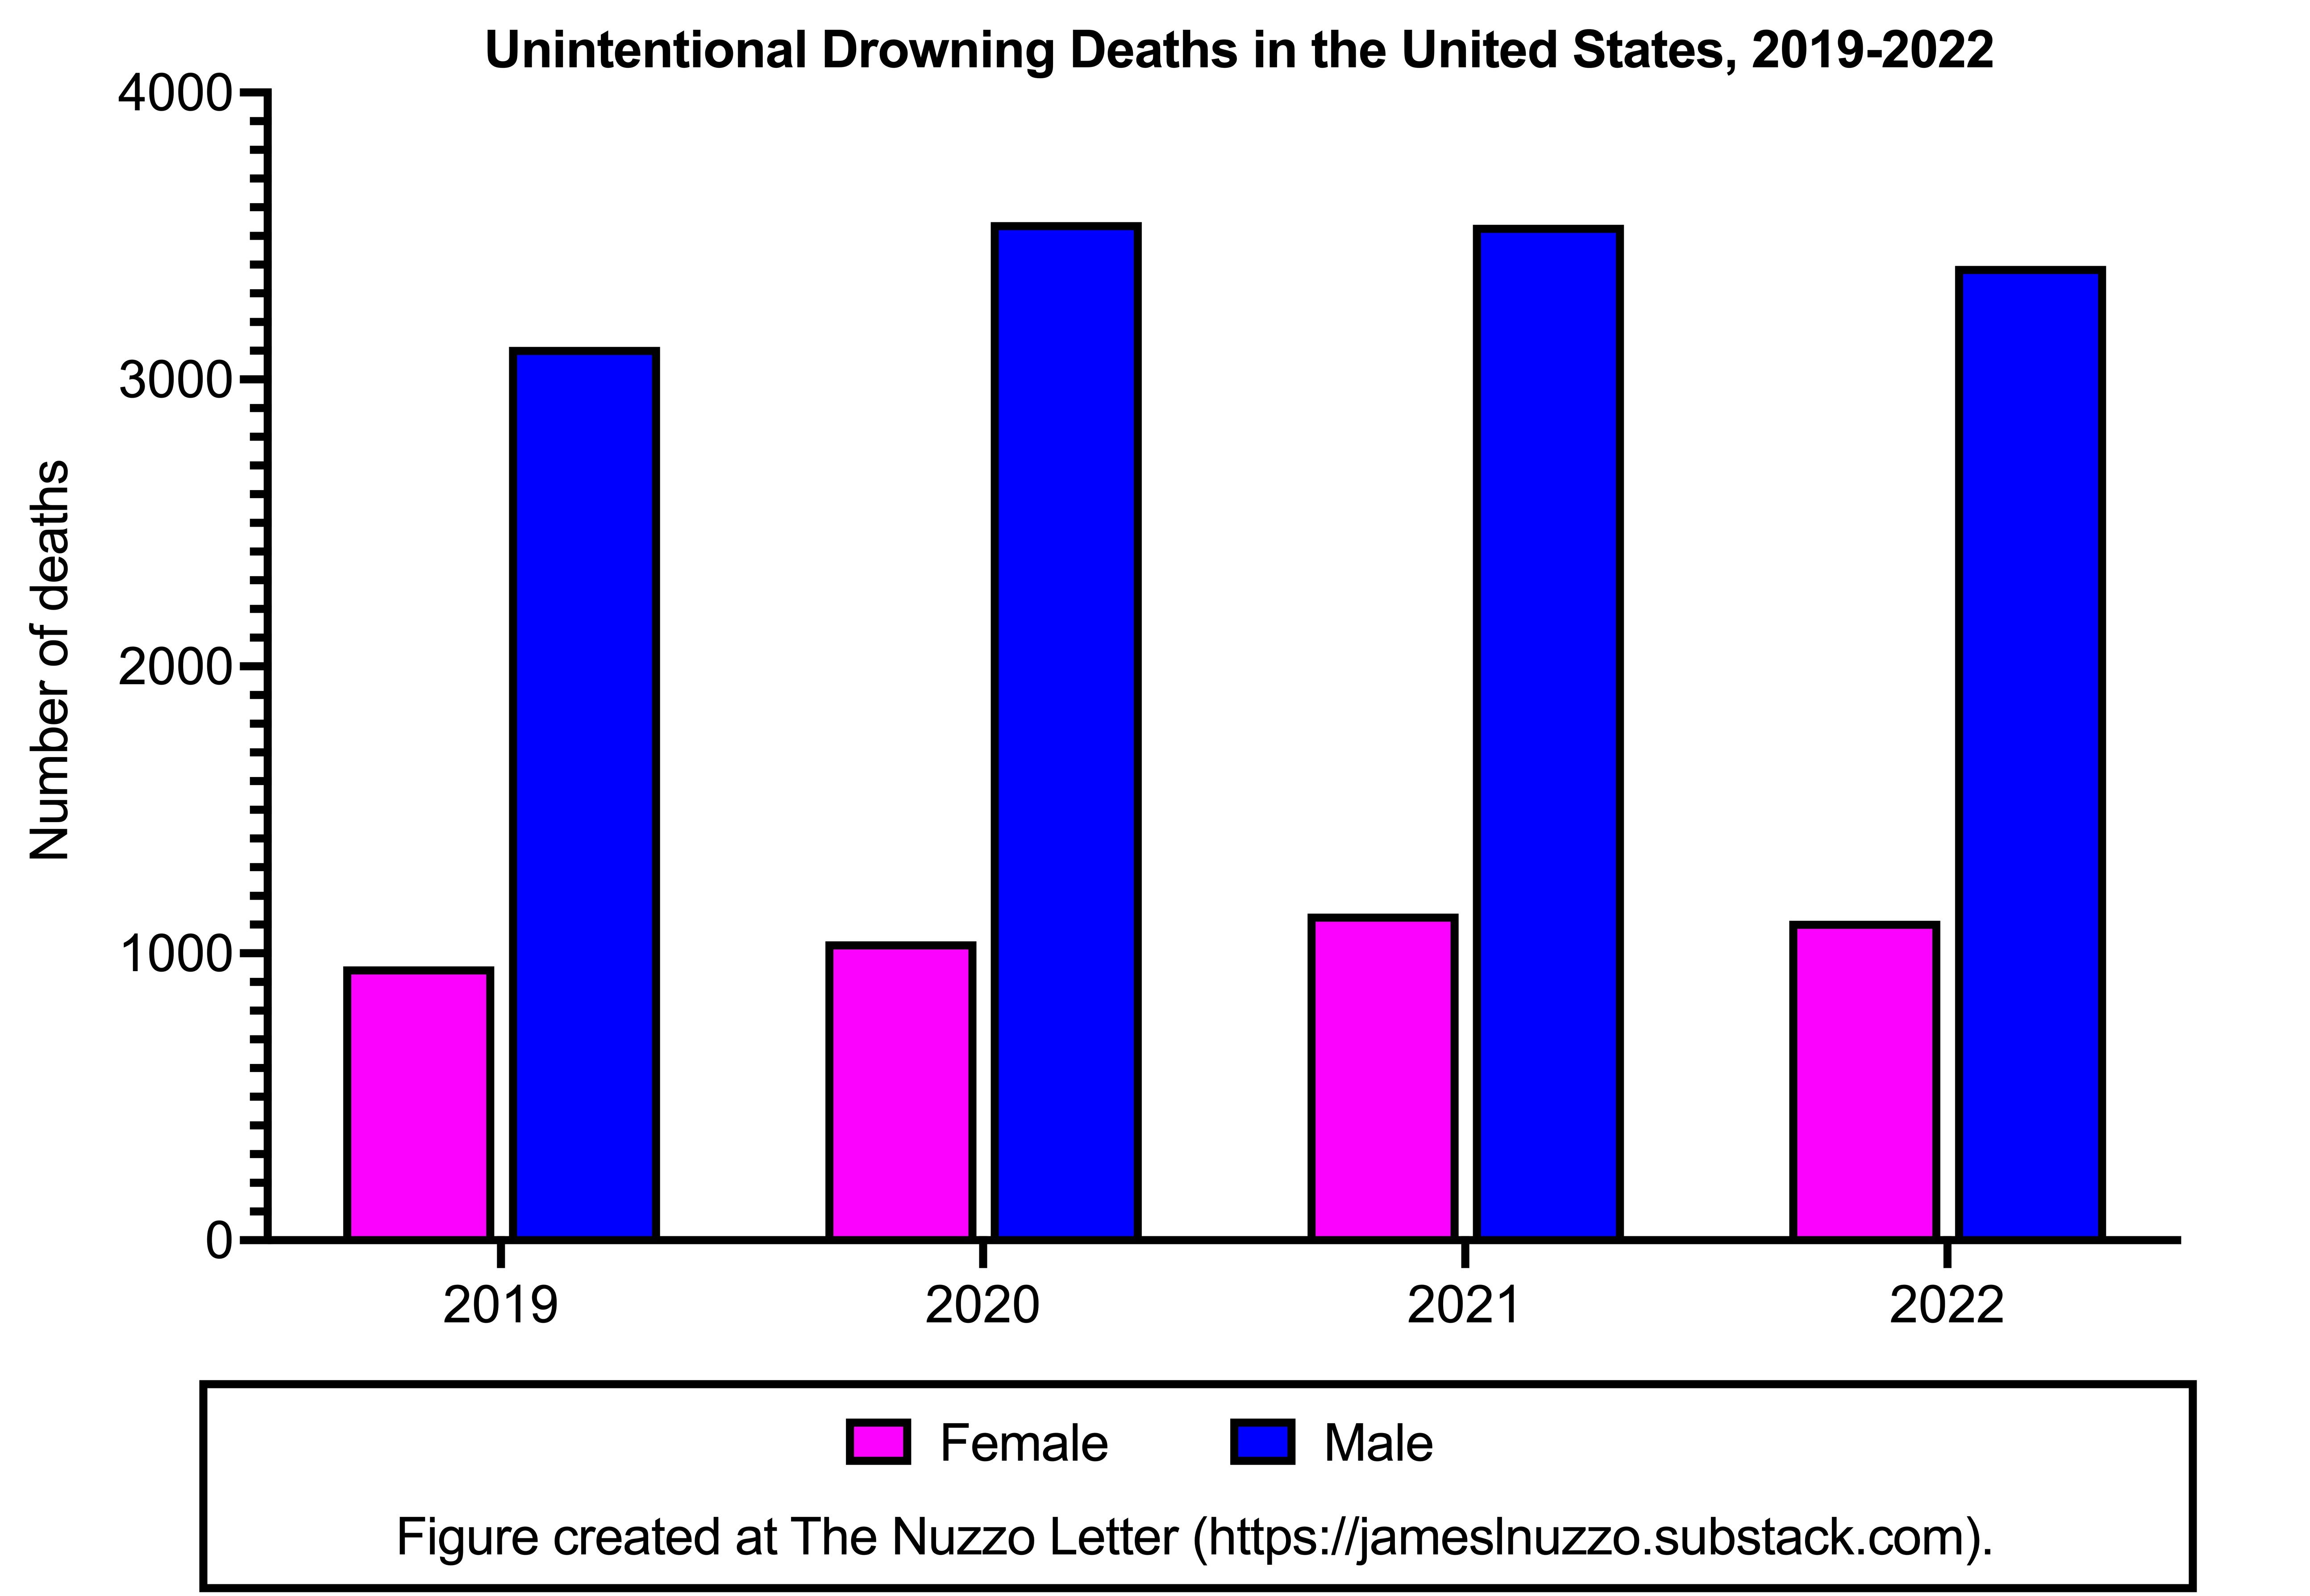
This week’s graph illustrates the numbers of males and females in the United States (U.S.) who died by unintentional drowning between 2019 and 2022.
Key Points
More males than females died by unintentional drowning. Each year, approximately 3,200 males died by unintentional drowning compared to about 1,000 females. Thus, males were three times more likely to die by unintentional drowning than females.
Over the four-year period between 2019 and 2022, a total of 13,599 males and 4,243 females died by unintentional drowning.
Source: Clemens T, Moreland B, Mack KA, Thomas K, Bergen G, Lee R. Vital Signs: Drowning Death Rates, Self-Reported Swimming Skill, Swimming Lesson Participation, and Recreational Water Exposure — United States, 2019–2023. MMWR Morb Mortal Wkly Rep 2024;73:467–473.
Bonus Commentary
Unintentional drowning is a significant men’s health issue. It is one of several contributors to shorter male than female life expectancy. Acute alcohol intoxication is a common cause of unintentional drowning deaths among males.
Related Content at The Nuzzo Letter


SUPPORT THE NUZZO LETTER
If you appreciated this content, please consider supporting The Nuzzo Letter with a one-time or recurring donation. Your support is greatly appreciated. It helps me to continue to work on independent research projects and fight for my evidence-based discourse. To donate, click the DonorBox logo. In two simple steps, you can donate using ApplePay, PayPal, or another service. Thank you!

Witches float?